Category: Methods
All topics
-

Do online consultations make citizens more satisfied with local democracy?
We find that giving citizens an opportunity to have a say in political decisions influences…
-

How policy makers can extract meaningful public opinion data from social media to inform their actions
Examining how the information available on social media can support the actions of politicians and…
-

P-values are widely used in the social sciences, but often misunderstood: and that’s a problem.
We need to make standards for interpreting p-values more stringent, and also improve transparency in…
-
Facts and figures or prayers and hugs: how people with different health conditions support each other online
Online support groups are one of the major ways in which the Internet has fundamentally…
-
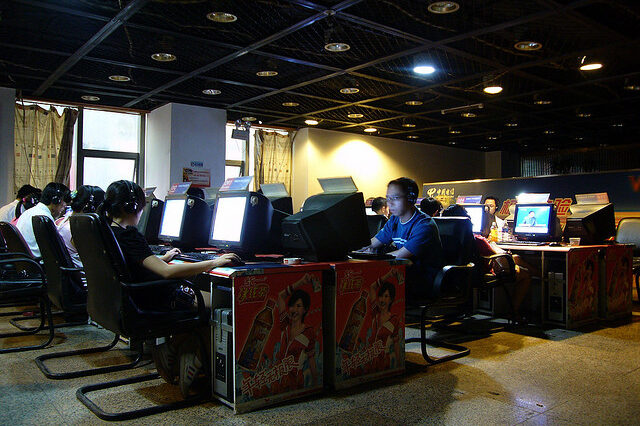
How easy is it to research the Chinese web?
The research expectations seem to be that control and intervention by Beijing will be most…
-

Mapping collective public opinion in the Russian blogosphere
The Russian language blogosphere counts about 85 million blogs—an amount far beyond the capacities of…
-

Edit wars! Measuring and mapping society’s most controversial topics
Although some topics are globally debated, like religion and politics, there are many topics which…
-

The physics of social science: using big data for real-time predictive modelling
There are very interesting examples of using big data to make predictions about disease outbreaks,…
-

Can text mining help handle the data deluge in public policy analysis?
There has been a major shift in the policies of governments concerning participatory governance—that is,…
-

Can Twitter provide an early warning function for the next pandemic?
While traditional surveillance systems will remain the pillars of public health, online media monitoring has…
-

Who represents the Arab world online?
The Middle East and North Africa are relatively under-represented in Wikipedia. Even after accounting for…
-

Harnessing ‘generative friction’: can conflict actually improve quality in open systems?
The more that differing points of view and differing evaluative frames came into contact, the…