Category: Methods
All topics
-

Predicting elections on Twitter: a different way of thinking about the data
Social media monitoring, which in theory can extract information from tweets and Facebook posts and…
-
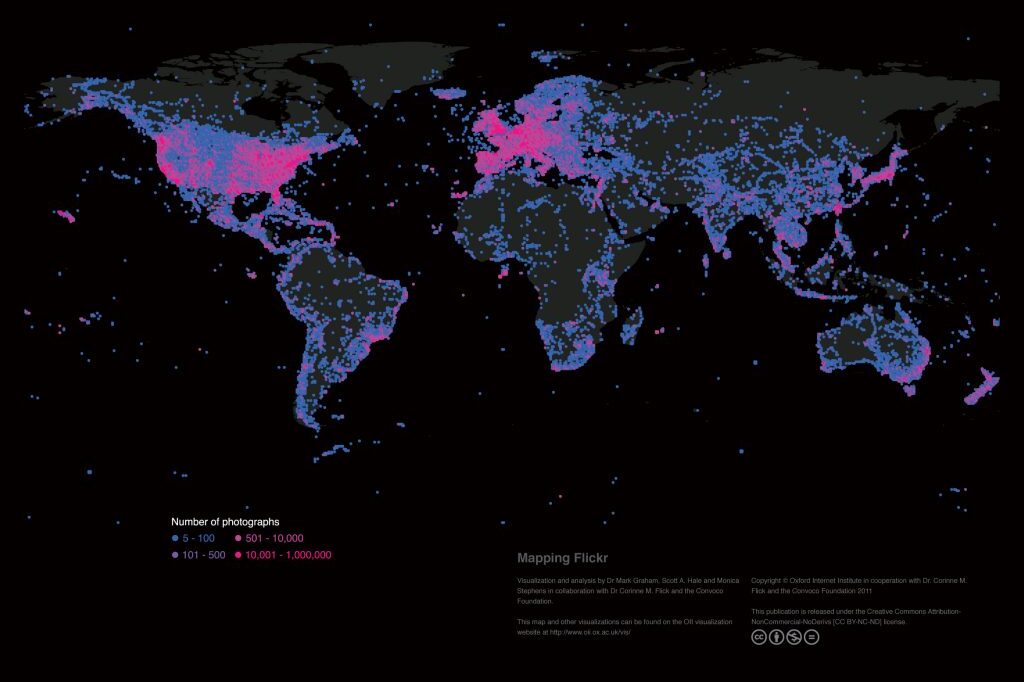
Mapping the uneven geographies of information worldwide
There are massive inequalities that cannot simply be explained by uneven Internet penetration. A range…
-

Investigating the structure and connectivity of online global protest networks
The new networks of political protest, which harness these new online technologies are often described…
-

How accessible are online legislative data archives to political scientists?
Government agencies are rarely completely transparent, often do not provide clear instructions for accessing the…
-

Experiments are the most exciting thing on the UK public policy horizon
Very few of these experiments use manipulation of information environments on the internet as a…
-

Uncovering the structure of online child exploitation networks
Despite large investments of law enforcement resources, online child exploitation is nowhere near under control,…
-

Slicing digital data: methodological challenges in computational social science
Small changes in individual actions can have large effects at the aggregate level; this opens…