Category: Social Data Science
All topics
-

In a world of “connective action” — what makes an influential Twitter user?
The new level of connectivity (particularly of social media) raises important questions about its role…
-
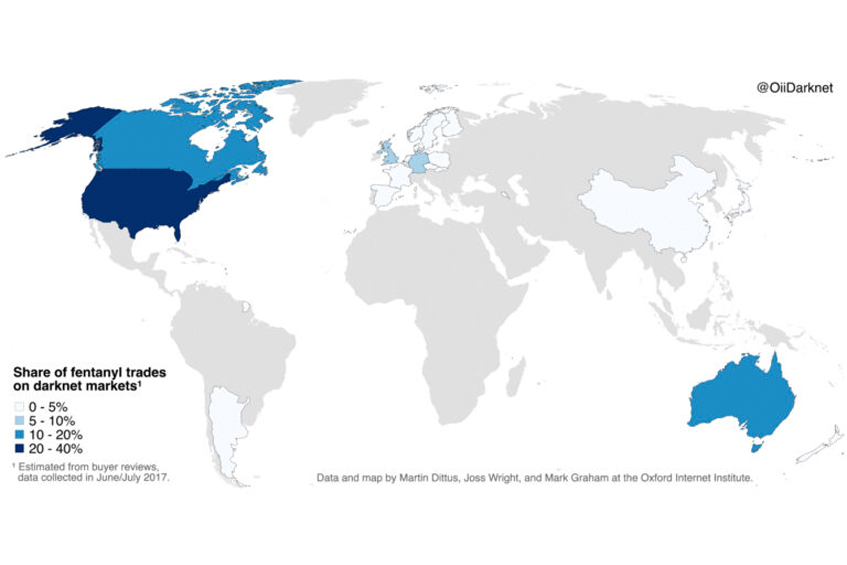
Mapping Fentanyl Trades on the Darknet
The US accounts for almost 40% of global darknet trade, with Canada and Australia at…
-

Our knowledge of how automated agents interact is rather poor (and that could be a problem)
We might expect bot interactions to be relatively predictable and uneventful.
-

Did you consider Twitter’s (lack of) representativeness before doing that predictive study?
Do Twitter users share identical characteristics with the population interest? For what populations are Twitter…
-
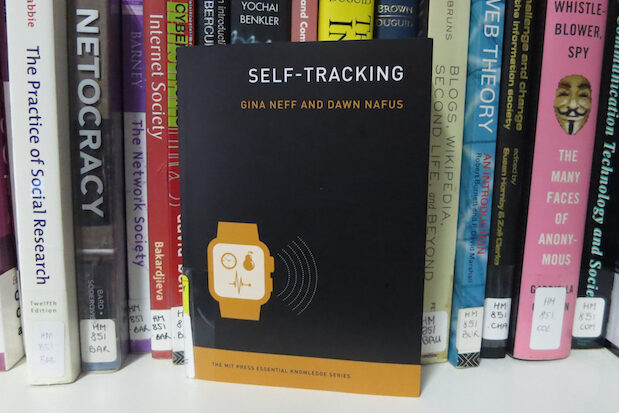
Exploring the world of self-tracking: who wants our data and why?
What happens when we turn our everyday experience—in particular, health and wellness-related experience—into data?
-
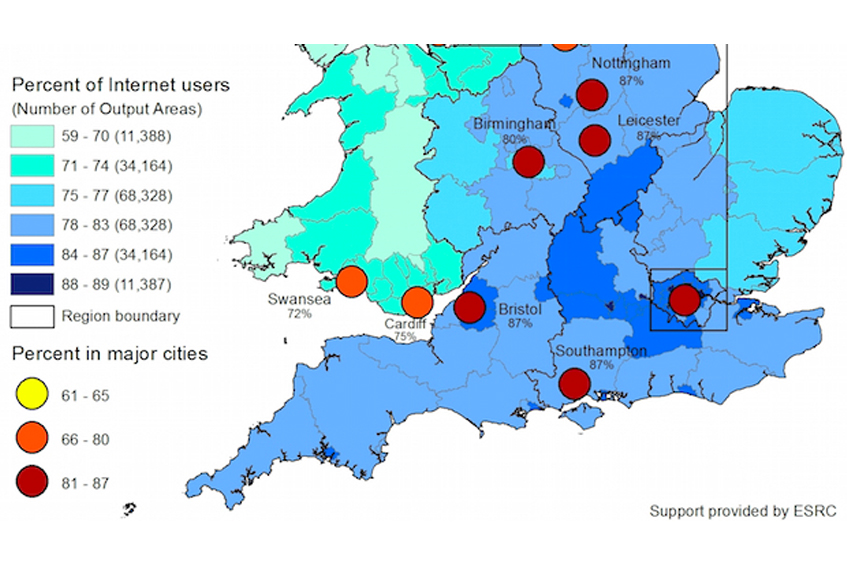
Estimating the Local Geographies of Digital Inequality in Britain: London and the South East Show Highest Internet Use—But Why?
Britain has one of the largest Internet economies in the developed world, and the Internet…
-

Edit wars! Examining networks of negative social interaction
– in Social Data ScienceWhile these interactions are less common, they strongly affect people’s psychological well-being, physical health, and…
-

Sexism Typology: Literature Review
– in Social Data ScienceDrawing on the rich history of gender studies in the social sciences, coupling it with…
-

Alan Turing Institute and OII: Summit on Data Science for Government and Policy Making
Leading policy makers, data scientists and academics came together to discuss how the ATI and…
-

P-values are widely used in the social sciences, but often misunderstood: and that’s a problem.
We need to make standards for interpreting p-values more stringent, and also improve transparency in…
-

Facts and figures or prayers and hugs: how people with different health conditions support each other online
Online support groups are one of the major ways in which the Internet has fundamentally…
-

Topic modelling content from the “Everyday Sexism” project: what’s it all about?
– in Social Data ScienceHow does the topic modelling algorithm ‘discover’ the topics within the context of everyday sexism?