open data

Mapping out the different meanings of open government, and how it is framed by different national governments.

The rhetoric of innovation and openness is bipartisan at the national level in Europe. Crowd celebrating the election victory of moderniser Emmanuel Macron, by Lorie Shaull (Flickr CC BY-SA 2.0).

Open government policies are spreading across Europe, challenging previous models of the public sector, and defining new forms of relationship between government, citizens, and digital technologies. In their Policy & Internet article “Why Choose Open Government? Motivations for the Adoption of Open Government Policies in Four European Countries,” Emiliana De Blasio and Donatella Selva present a qualitative analysis of policy documents from France, Italy, Spain, and the UK, in order to map out the different meanings of open government, and how it is framed by different national governments. As a policy agenda, open government can be thought of as involving four variables: transparency, participation, collaboration, and digital technologies in democratic processes. Although the variables are all interpreted in different ways, participation, collaboration, and digital technology provide the greatest challenge to government, given they imply a major restructuring of public administration, whereas transparency goals (i.e., the disclosure of open data and the provision of monitoring tools) do not. Indeed, transparency is mentioned in the earliest accounts of open government from the 1950s. The authors show the emergence of competing models of open government in Europe, with transparency and digital technologies being the most prominent issues in open government, and participation and collaboration being less considered and implemented. The standard model of open government seems to stress innovation and openness, and occasionally of public-private collaboration, but fails to achieve open decision making, with the policy-making process typically rooted in existing mechanisms. However, the authors also see the emergence of a policy framework within which democratic innovations can develop, testament to the vibrancy of the relationship between citizens and the public administration in contemporary European democracies. We caught up with the authors to discuss their findings: Ed.: Would you say there are more similarities than differences between these countries’ approaches and expectations for open government? What were your main findings (briefly)? Emiliana / Donatella: We can imagine the four European countries (France, Italy,…

Advocates hope that opening government data will increase government transparency, catalyse economic growth, address social and environmental challenges.

Advocates hope that opening government data will increase government transparency, catalyse economic growth, address social and environmental challenges. Image by the UK’s Open Data Institute.

Community-based approaches are widely employed in programmes that monitor and promote socioeconomic development. And building the “capacity” of a community—i.e. the ability of people to act individually or collectively to benefit the community—is key to these approaches. The various definitions of community capacity all agree that it comprises a number of dimensions—including opportunities and skills development, resource mobilisation, leadership, participatory decision making, etc.—all of which can be measured in order to understand and monitor the implementation of community-based policy. However, measuring these dimensions (typically using surveys) is time consuming and expensive, and the absence of such measurements is reflected in a greater focus in the literature on describing the process of community capacity building, rather than on describing how it’s actually measured. A cheaper way to measure these dimensions, for example by applying predictive algorithms to existing secondary data like socioeconomic characteristics, socio-demographics, and condition of housing stock, would certainly help policy makers gain a better understanding of local communities. In their Policy & Internet article “Predicting Sense of Community and Participation by Applying Machine Learning to Open Government Data”, Alessandro Piscopo, Ronald Siebes, and Lynda Hardman employ a machine-learning technique (“Random Forests”) to evaluate an estimate of community capacity derived from open government data, and determine the most important predictive variables. The resulting models were found to be more accurate than those based on traditional statistics, demonstrating the feasibility of the Random Forests technique for this purpose—being accurate, able to deal with small data sets and nonlinear data, and providing information about how each variable in the dataset contributes to predictive accuracy. We caught up with the authors to discuss their findings: Ed.: Just briefly: how did you do the study? Were you essentially trying to find which combinations of variables available in Open Government Data predicted “sense of community and participation” as already measured by surveys? Authors: Our research stemmed from an observation of the measures of social…

Reflect upon the barriers preventing the OGD agenda from making a breakthrough into the mainstream.

Advocates hope that opening government data will increase government transparency, catalyse economic growth, address social and environmental challenges. Image by the UK's Open Data Institute.

Advocates of Open Government Data (OGD)—that is, data produced or commissioned by government or government-controlled entities that can be freely used, reused and redistributed by anyone—talk about the potential of such data to increase government transparency, catalyse economic growth, address social and environmental challenges and boost democratic participation. This heady mix of potential benefits has proved persuasive to the UK Government (and governments around the world). Over the past decade, since the emergence of the OGD agenda, the UK Government has invested extensively in making more of its data open. This investment has included £10 million to establish the Open Data Institute and a £7.5 million fund to support public bodies overcome technical barriers to releasing open data. Yet the transformative impacts claimed by OGD advocates, in government as well as NGOs such as the Open Knowledge Foundation, still seem a rather distant possibility. Even the more modest goal of integrating the creation and use of OGD into the mainstream practices of government, businesses and citizens remains to be achieved. In my recent article Barriers to the Open Government Data Agenda: Taking a Multi-Level Perspective (Policy & Internet 6:3) I reflect upon the barriers preventing the OGD agenda from making a breakthrough into the mainstream. These reflections centre on the five key finds of a survey exploring where key stakeholders within the UK OGD community perceive barriers to the OGD agenda. The key messages from the UK OGD community are that: 1. Barriers to the OGD agenda are perceived to be widespread  Unsurprisingly, given the relatively limited impact of OGD to date, my research shows that barriers to the OGD agenda are perceived to be widespread and numerous in the UK’s OGD community. What I find rather more surprising is the expectation, amongst policy makers, that these barriers ought to just melt away when exposed to the OGD agenda’s transparently obvious value and virtue. Given that the breakthrough of the…

The platform aims to create long-lasting scientific value with minimal technical entry barriers—it is valuable to have a global resource that combines photographs generated by Project Pressure in less documented areas.

Ed: Project Pressure has created a platform for crowdsourcing glacier imagery, often photographs taken by climbers and trekkers. Why are scientists interested in these images? And what’s the scientific value of the data set that’s being gathered by the platform? Klaus: Comparative photography using historical photography allows year-on-year comparisons to document glacier change. The platform aims to create long-lasting scientific value with minimal technical entry barriers—it is valuable to have a global resource that combines photographs generated by Project Pressure in less documented areas, with crowdsourced images taken by for example by climbers and trekkers, combined with archival pictures. The platform is future focused and will hopefully allow an up-to-date view on glaciers across the planet. The other ways for scientists to monitor glaciers takes a lot of time and effort; direct measurements of snow fall is a complicated, resource intensive and time-consuming process. And while glacier outlines can be traced from satellite imagery, this still needs to be done manually. Also, you can’t measure the thickness, images can be obscured by debris and cloud cover, and some areas just don’t have very many satellite fly-bys. Ed: There are estimates that the glaciers of Montana’s Glacier National Park will likely to be gone by 2020 and the Ugandan glaciers by 2025, and the Alps are rapidly turning into a region of lakes. These are the famous and very visible examples of glacier loss—what’s the scale of the missing data globally? Klaus: There’s a lot of great research being conducted in this area, however there are approximately 300,000 glaciers world wide, with huge data gaps in South America and the Himalayas for instance. Sharing of Himalayan data between Indian and Chinese scientists has been a sensitive issue, given glacier meltwater is an important strategic resource in the region. But this is a popular trekking route, and it is relatively easy to gather open-source data from the public. Furthermore, there are also…

The internet has provided citizens with a greater capacity for coordination and mobilisation, which can strengthen their voice and representation in the policy agenda.

The Internet has multiplied the platforms available to influence public opinion and policy making. It has also provided citizens with a greater capacity for coordination and mobilisation, which can strengthen their voice and representation in the policy agenda. As waves of protest sweep both authoritarian regimes and liberal democracies, this rapidly developing field calls for more detailed enquiry. However, research exploring the relationship between online mobilisation and policy change is still limited. This special issue of ‘Policy and Internet’ addresses this gap through a variety of perspectives. Contributions to this issue view the Internet both as a tool that allows citizens to influence policy making, and as an object of new policies and regulations, such as data retention, privacy, and copyright laws, around which citizens are mobilising. Together, these articles offer a comprehensive empirical account of the interface between online collective action and policy making. Within this framework, the first article in this issue, “Networked Collective Action and the Institutionalized Policy Debate: Bringing Cyberactivism to the Policy Arena?” by Stefania Milan and Arne Hintz (2013), looks at the Internet as both a tool of collective action and an object of policy. The authors provide a comprehensive overview of how computer-mediated communication creates not only new forms of organisational structure for collective action, but also new contentious policy fields. By focusing on what the authors define as ‘techie activists,’ Milan and Hintz explore how new grassroots actors participate in policy debates around the governance of the Internet at different levels. This article provides empirical evidence to what Kriesi et al. (1995) defines as “windows of opportunities” for collective action to contribute to the policy debate around this new space of contentious politics. Milan and Hintz demonstrate how this has happened from the first World Summit of Information Society (WSIS) in 2003 to more recent debates about Internet regulation. Yana Breindl and François Briatte’s (2013) article “Digital Protest Skills and Online Activism Against…

The Internet can be hugely useful to coordinate disaster relief efforts, or to help rebuild affected communities.

Wikimedia Commons

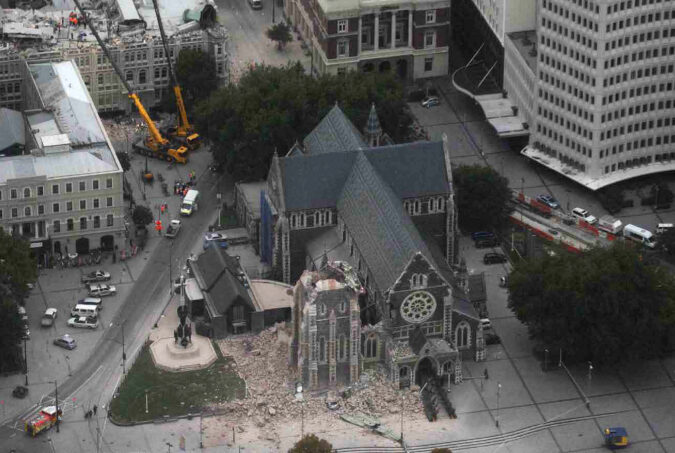
The 6.2 magnitude earthquake that struck the centre of Christchurch on 22 February 2011 claimed 185 lives, damaged 80% of the central city beyond repair, and forced the abandonment of 6000 homes. It was the third costliest insurance event in history. The CEISMIC archive developed at the University of Canterbury will soon have collected almost 100,000 digital objects documenting the experiences of the people and communities affected by the earthquake, all of it available for study. The Internet can be hugely useful to coordinate disaster relief efforts, or to help rebuild affected communities. Paul Millar came to the OII on 21 May 2012 to discuss the CEISMIC archive project and the role of digital humanities after a major disaster (below). We talked to him afterwards. Ed: You have collected a huge amount of information about the earthquake and people’s experiences that would otherwise have been lost: how do you think it will be used? Paul: From the beginning I was determined to avoid being prescriptive about eventual uses. The secret of our success has been to stick to the principles of open data, open access and collaboration—the more content we can collect, the better chance future generations have to understand and draw conclusions from our experiences, behaviour and decisions. We have already assisted a number of research projects in public health, the social and physical sciences; even accounting. One of my colleagues reads balance sheets the way I read novels, and discovers all sorts of earthquake-related signs of cause and effect in them. I’d never have envisaged such a use for the archive. We have made our ontology is as detailed and flexible as possible in order to help with re-purposing of primary material: we currently use three layers of metadata—machine generated, human-curated and crowd sourced. We also intend to work more seriously on our GIS capabilities. Ed: How do you go about preserving this information during a period of…