Could Counterfactuals Explain Algorithmic Decisions Without Opening the Black Box?

The EU General Data Protection Regulation (GDPR) has sparked much discussion about the “right to explanation” for the algorithm-supported decisions made about us in our everyday lives. While there’s an obvious need for transparency in the automated decisions that are increasingly being made in areas like policing, education, healthcare and recruitment, explaining how these complex algorithmic decision-making systems arrive at any particular decision is a technically challenging problem—to put it mildly.

In their article “Counterfactual Explanations without Opening the Black Box: Automated Decisions and the GDPR” which is forthcoming in the Harvard Journal of Law & Technology, Sandra Wachter, Brent Mittelstadt, and Chris Russell present the concept of “unconditional counterfactual explanations” as a novel type of explanation of automated decisions that could address many of these challenges. Counterfactual explanations describe the minimum conditions that would have led to an alternative decision (e.g. a bank loan being approved), without the need to describe the full logic of the algorithm.

Relying on counterfactual explanations as a means to help us act rather than merely to understand could help us gauge the scope and impact of automated decisions in our lives. They might also help bridge the gap between the interests of data subjects and data controllers, which might otherwise be a barrier to a legally binding right to explanation.

We caught up with the authors to explore the role of algorithms in our everyday lives, and how a “right to explanation” for decisions might be achievable in practice:

Ed: There’s a lot of discussion about algorithmic “black boxes” — where decisions are made about us, using data and algorithms about which we (and perhaps the operator) have no direct understanding. How prevalent are these systems?

Sandra: Basically, every decision that can be made by a human can now be made by an algorithm. Which can be a good thing. Algorithms (when we talk about artificial intelligence) are very good at spotting patterns and correlations that even experienced humans might miss, for example in predicting disease. They are also very cost efficient—they don’t get tired, and they don’t need holidays. This could help to cut costs, for example in healthcare.

Algorithms are also certainly more consistent than humans in making decisions. We have the famous example of judges varying the severity of their judgements depending on whether or not they’ve had lunch. That wouldn’t happen with an algorithm. That’s not to say algorithms are always going to make better decisions: but they do make more consistent ones. If the decision is bad, it’ll be distributed equally, but still be bad. Of course, in a certain way humans are also black boxes—we don’t understand what humans do either. But you can at least try to understand an algorithm: it can’t lie, for example.

Brent: In principle, any sector involving human decision-making could be prone to decision-making by algorithms. In practice, we already see algorithmic systems either making automated decisions or producing recommendations for human decision-makers in online search, advertising, shopping, medicine, criminal justice, etc. The information you consume online, the products you are recommended when shopping, the friends and contacts you are encouraged to engage with, even assessments of your likelihood to commit a crime in the immediate and long-term future—all of these tasks can currently be affected by algorithmic decision-making.

Ed: I can see that algorithmic decision-making could be faster and better than human decisions in many situations. Are there downsides?

Sandra: Simple algorithms that follow a basic decision tree (with parameters decided by people) can be easily understood. But we’re now also using much more complex systems like neural nets that act in a very unpredictable way, and that’s the problem. The system is also starting to become autonomous, rather than being under the full control of the operator. You will see the output, but not necessarily why it got there. This also happens with humans, of course: I could be told by a recruiter that my failure to land a job had nothing to do with my gender (even if it did); an algorithm, however, would not intentionally lie. But of course the algorithm might be biased against me if it’s trained on biased data—thereby reproducing the biases of our world.

We have seen that the COMPAS algorithm used by US judges to calculate the probability of re-offending when making sentencing and parole decisions is a major source of discrimination. Data provenance is massively important, and probably one of the reasons why we have biased decisions. We don’t necessarily know where the data comes from, and whether it’s accurate, complete, biased, etc. We need to have lots of standards in place to ensure that the data set is unbiased. Only then can the algorithm produce nondiscriminatory results.

A more fundamental problem with predictions is that you might never know what would have happened—as you’re just dealing with probabilities; with correlations in a population, rather than with causalities. Another problem is that algorithms might produce correct decisions, but not necessarily fair ones. We’ve been wrestling with the concept of fairness for centuries, without consensus. But lack of fairness is certainly something the system won’t correct itself—that’s something that society must correct.

Brent: The biases and inequalities that exist in the real world and in real people can easily be transferred to algorithmic systems. Humans training learning systems can inadvertently or purposefully embed biases into the model, for example through labelling content as ‘offensive’ or ‘inoffensive’ based on personal taste. Once learned, these biases can spread at scale, exacerbating existing inequalities. Eliminating these biases can be very difficult, hence we currently see much research done on the measurement of fairness or detection of discrimination in algorithmic systems.

These systems can also be very difficult—if not impossible—to understand, for experts as well as the general public. We might traditionally expect to be able to question the reasoning of a human decision-maker, even if imperfectly, but the rationale of many complex algorithmic systems can be highly inaccessible to people affected by their decisions. These potential risks aren’t necessarily reasons to forego algorithmic decision-making altogether; rather, they can be seen as potential effects to be mitigated through other means (e.g. a loan programme weighted towards historically disadvantaged communities), or at least to be weighed against the potential benefits when choosing whether or not to adopt a system.

Ed: So it sounds like many algorithmic decisions could be too complex to “explain” to someone, even if a right to explanation became law. But you propose “counterfactual explanations” as an alternative— i.e. explaining to the subject what would have to change (e.g. about a job application) for a different decision to be arrived at. How does this simplify things?

Brent: So rather than trying to explain the entire rationale of a highly complex decision-making process, counterfactuals allow us to provide simple statements about what would have needed to be different about an individual’s situation to get a different, preferred outcome. You basically work from the outcome: you say “I am here; what is the minimum I need to do to get there?” By providing simple statements that are generally meaningful, and that reveal a small bit of the rationale of a decision, the individual has grounds to change their situation or contest the decision, regardless of their technical expertise. Understanding even a bit of how a decision is made is better than being told “sorry, you wouldn’t understand”—at least in terms of fostering trust in the system.

Sandra: And the nice thing about counterfactuals is that they work with highly complex systems, like neural nets. They don’t explain why something happened, but they explain what happened. And three things people might want to know are:

(1) What happened: why did I not get the loan (or get refused parole, etc.)?

(2) Information so I can contest the decision if I think it’s inaccurate or unfair.

(3) Even if the decision was accurate and fair, tell me what I can do to improve my chances in the future.

Machine learning and neural nets make use of so much information that individuals have really no oversight of what they’re processing, so it’s much easier to give someone an explanation of the key variables that affected the decision. With the counterfactual idea of a “close possible world” you give an indication of the minimal changes required to get what you actually want.

Ed: So would a series of counterfactuals (e.g. “over 18” “no prior convictions” “no debt”) essentially define a space within which a certain decision is likely to be reached? This decision space could presumably be graphed quite easily, to help people understand what factors will likely be important in reaching a decision?

Brent: This would only work for highly simplistic, linear models, which are not normally the type that confound human capacities for understanding. The complex systems that we refer to as ‘black boxes’ are highly dimensional and involve a multitude of (probabilistic) dependencies between variables that can’t be graphed simply. It may be the case that if I were aged between 35-40 with an income of £30,000, I would not get a loan. But, I could be told that if I had an income of £35,000, I would have gotten the loan. I may then assume that an income over £35,000 guarantees me a loan in the future. But, it may turn out that I would be refused a loan with an income above £40,000 because of a change in tax bracket. Non-linear relationships of this type can make it misleading to graph decision spaces. For simple linear models, such a graph may be a very good idea, but not for black box systems; they could, in fact, be highly misleading.

Chris: As Brent says, we’re concerned with understanding complicated algorithms that don’t just use hard cut-offs based on binary features. To use your example, maybe a little bit of debt is acceptable, but it would increase your risk of default slightly, so the amount of money you need to earn would go up. Or maybe certain convictions committed in the past also only increase your risk of defaulting slightly, and can be compensated for with higher salary. It’s not at all obvious how you could graph these complicated interdependencies over many variables together. This is why we picked on counterfactuals as a way to give people a direct and easy to understand path to move from the decision they got now, to a more favourable one at a later date.

Ed: But could a counterfactual approach just end up kicking the can down the road, if we know “how” a particular decision was reached, but not “why” the algorithm was weighted in such a way to produce that decision?

Brent: It depends what we mean by “why”. If this is “why” in the sense of, why was the system designed this way, to consider this type of data for this task, then we should be asking these questions while these systems are designed and deployed. Counterfactuals address decisions that have already been made, but still can reveal uncomfortable knowledge about a system’s design and functionality. So it can certainly inform “why” questions.

Sandra: Just to echo Brent, we don’t want to imply that asking the “why” is unimportant—I think it’s very important, and interpretability as a field has to be pursued, particularly if we’re using algorithms in highly sensitive areas. Even if we have the “what”, the “why” question is still necessary to ensure the safety of those systems.

Chris: And anyone who’s talked to a three-year old knows there is an endless stream of “Why” questions that can be asked. But already, counterfactuals provide a major step forward in answering why, compared to previous approaches that were concerned with providing approximate descriptions of how algorithms make decisions—but not the “why” or the external facts leading to that decision. I think when judging the strength of an explanation, you also have to look at questions like “How easy is this to understand?” and “How does this help the person I’m explaining things to?” For me, counterfactuals are a more immediately useful explanation, than something which explains where the weights came from. Even if you did know, what could you do with that information?

Ed: I guess the question of algorithmic decision making in society involves a hugely complex intersection of industry, research, and policy making? Are we control of things?

Sandra: Artificial intelligence (and the technology supporting it) is an area where many sectors are now trying to work together, including in the crucial areas of fairness, transparency and accountability of algorithmic decision-making. I feel at the moment we see a very multi-stakeholder approach, and I hope that continues in the future. We can see for example that industry is very concerned with it—the Partnership in AI is addressing these topics and trying to come up with a set of industry guidelines, recognising the responsibilities inherent in producing these systems. There are also lots of data scientists (eg at the OII and Turing Institute) working on these questions. Policy-makers around the world (e.g. UK, EU, US, China) preparing their countries for the AI future, so it’s on everybody’s mind at the moment. It’s an extremely important topic.

Law and ethics obviously has an important role to play. The opacity, unpredictability of AI and its potentially discriminatory nature, requires that we think about the legal and ethical implications very early on. That starts with educating the coding community, and ensuring diversity. At the same time, it’s important to have an interdisciplinary approach. At the moment we’re focusing a bit too much on the STEM subjects; there’s a lot of funding going to those areas (which makes sense, obviously), but the social sciences are currently a bit neglected despite the major role they play in recognising things like discrimination and bias, which you might not recognise from just looking at code.

Brent: Yes—and we’ll need much greater interaction and collaboration between these sectors to stay ‘in control’ of things, so to speak. Policy always has a tendency to lag behind technological developments; the challenge here is to stay close enough to the curve to prevent major issues from arising. The potential for algorithms to transform society is massive, so ensuring a quicker and more reflexive relationship between these sectors than normal is absolutely critical.

Read the full article: Sandra Wachter, Brent Mittelstadt, Chris Russell (2018) Counterfactual Explanations without Opening the Black Box: Automated Decisions and the GDPR. Harvard Journal of Law & Technology (Forthcoming).

This work was supported by The Alan Turing Institute under the EPSRC grant EP/N510129/1.


Sandra Wachter, Brent Mittelstadt and Chris Russell were talking to blog editor David Sutcliffe.

Can we predict electoral outcomes from Wikipedia traffic?

As digital technologies become increasingly integrated into the fabric of social life their ability to generate large amounts of information about the opinions and activities of the population increases. The opportunities in this area are enormous: predictions based on socially generated data are much cheaper than conventional opinion polling, offer the potential to avoid classic biases inherent in asking people to report their opinions and behaviour, and can deliver results much quicker and be updated more rapidly.

In their article published in EPJ Data Science, Taha Yasseri and Jonathan Bright develop a theoretically informed prediction of election results from socially generated data combined with an understanding of the social processes through which the data are generated. They can thereby explore the predictive power of socially generated data while enhancing theory about the relationship between socially generated data and real world outcomes. Their particular focus is on the readership statistics of politically relevant Wikipedia articles (such as those of individual political parties) in the time period just before an election.

By applying these methods to a variety of different European countries in the context of the 2009 and 2014 European Parliament elections they firstly show that the relative change in number of page views to the general Wikipedia page on the election can offer a reasonable estimate of the relative change in election turnout at the country level. This supports the idea that increases in online information seeking at election time are driven by voters who are considering voting.

Second, they show that a theoretically informed model based on previous national results, Wikipedia page views, news media mentions, and basic information about the political party in question can offer a good prediction of the overall vote share of the party in question. Third, they present a model for predicting change in vote share (i.e., voters swinging towards and away from a party), showing that Wikipedia page-view data provide an important increase in predictive power in this context.

This relationship is exaggerated in the case of newer parties — consistent with the idea that voters don’t seek information uniformly about all parties at election time. Rather, they behave like ‘cognitive misers’, being more likely to seek information on new political parties with which they do not have previous experience and being more likely to seek information only when they are actually changing the way they vote.

In contrast, there was no evidence of a ‘media effect’: there was little correlation between news media mentions and overall Wikipedia traffic patterns. Indeed, the news media and Wikipedia appeared to be biased towards different things: with the news favouring incumbent parties, and Wikipedia favouring new ones.

Read the full article: Yasseri, T. and Bright, J. (2016) Wikipedia traffic data and electoral prediction: towards theoretically informed models. EPJ Data Science. 5 (1).

We caught up with the authors to explore the implications of the work.

Ed: Wikipedia represents a vast amount of not just content, but also user behaviour data. How did you access the page view stats — but also: is anyone building dynamic visualisations of Wikipedia data in real time?

Taha and Jonathan: Wikipedia makes its page view data available for free (in the same way as it makes all of its information available!). You can find the data here, along with some visualisations

Ed: Why did you use Wikipedia data to examine election prediction rather than (the I suppose the more fashionable) Twitter? How do they compare as data sources?

Taha and Jonathan: One of the big problems with using Twitter to predict things like elections is that contributing on social media is a very public thing and people are quite conscious of this. For example, some parties are seen as unfashionable so people might not make their voting choice explicit. Hence overall social media might seem to be saying one thing whereas actually people are thinking another.

By contrast, looking for information online on a website like Wikipedia is an essentially private activity so there aren’t these social biases. In other words, on Wikipedia we can directly have access to transactional data on what people do, rather than what they say or prefer to say.

Ed: How did these results and findings compare with the social media analysis done as part of our UK General Election 2015 Election Night Data Hack? (long title..)

Taha and Jonathan: The GE2015 data hack looked at individual politicians. We found that having a Wikipedia page is becoming increasingly important — over 40% of Labour and Conservative Party candidates had an individual Wikipedia page. We also found that this was highly correlated with Twitter presence — being more active on one network also made you more likely to be active on the other one. And we found some initial evidence that social media reaction was correlated with votes, though there is a lot more work to do here!

Ed: Can you see digital social data analysis replacing (or maybe just complementing) opinion polling in any meaningful way? And what problems would need to be addressed before that happened: e.g. around representative sampling, data cleaning, and weeding out bots?

Taha and Jonathan: Most political pundits are starting to look at a range of indicators of popularity — for example, not just voting intention, but also ratings of leadership competence, economic performance, etc. We can see good potential for social data to become part of this range of popularity indicator. However we don’t think it will replace polling just yet; the use of social media is limited to certain demographics. Also, the data collected from social media are often very shallow, not allowing for validation. In the case of Wikipedia, for example, we only know how many times each page is viewed, but we don’t know by how many people and from where.

Ed: You do a lot of research with Wikipedia data — has that made you reflect on your own use of Wikipedia?

Taha and Jonathan: It’s interesting to think about this activity of getting direct information about politicians — it’s essentially a new activity, something you couldn’t do in the pre-digital age. I know that I personally [Jonathan] use it to find out things about politicians and political parties — it would be interesting to know more about why other people are using it as well. This could have a lot of impacts. One thing Wikipedia has is a really long memory, in a way that other means of getting information on politicians (such as newspapers) perhaps don’t. We could start to see this type of thing becoming more important in electoral politics.

[Taha] .. since my research has been mostly focused on Wikipedia edit wars between human and bot editors, I have naturally become more cautious about the information I find on Wikipedia. When it comes to sensitive topics, sach as politics, Wikipedia is a good point to start, but not a great point to end the search!


Taha Yasseri and Jonathan Bright were talking to blog editor David Sutcliffe.

Topic modelling content from the “Everyday Sexism” project: what’s it all about?

We recently announced the start of an exciting new research project that will involve the use of topic modelling in understanding the patterns in submitted stories to the Everyday Sexism website. Here, we briefly explain our text analysis approach, “topic modelling”.

At its very core, topic modelling is a technique that seeks to automatically discover the topics contained within a group of documents. ‘Documents’ in this context could refer to text items as lengthy as individual books, or as short as sentences within a paragraph. Let’s take the idea of sentences-as-documents as an example:

  • Document 1: I like to eat kippers for breakfast.
  • Document 2: I love all animals, but kittens are the cutest.
  • Document 3: My kitten eats kippers too.

Assuming that each sentence contains a mixture of different topics (and that a ‘topic’ can be understood as a collection of words (of any part of speech) that have different probabilities of appearance in passages discussing the topic), how does the topic modelling algorithm ‘discover’ the topics within these sentences?

The algorithm is initiated by setting the number of topics that it needs to extract. Of course, it is hard to guess this number without having an insight on the topics, but one can think of this as a resolution tuning parameter. The smaller the number of topics is set, the more general the bag of words in each topic would be, and the looser the connections between them.

The algorithm loops through all of the words in each document, assigning every word to one of our topics in a temporary and semi-random manner. This initial assignment is arbitrary and it is easy to show that different initializations lead to the same results in long run. Once each word has been assigned a temporary topic, the algorithm then re-iterates through each word in each document to update the topic assignment using two criteria: 1) How prevalent is the word in question across topics? And 2) How prevalent are the topics in the document?

To quantify these two, the algorithm calculates the likelihood of the words appearing in each document assuming the assignment of words to topics and topics to documents. 

Of course words can appear in different topics and more than one topic can appear in a document. But the iterative algorithm seeks to maximize the self-consistency of the assignment by maximizing the likelihood of the observed word-document statistics. 

We can illustrate this process and its outcome by going back to our example. A topic modelling approach might use the process above to discover the following topics across our documents:

  • Document 1: I like to eat kippers for breakfast[100% Topic A]
  • Document 2: I love all animals, but kittens are the cutest. [100% Topic B]
  • Document 3: My kitten eats kippers too. [67% Topic A, 33% Topic B]

Topic modelling defines each topic as a so-called ‘bag of words’, but it is the researcher’s responsibility to decide upon an appropriate label for each topic based on their understanding of language and context. Going back to our example, the algorithm might classify the underlined words under Topic A, which we could then label as ‘food’ based on our understanding of what the words mean. Similarly the italicised words might be classified under a separate topic, Topic B, which we could label ‘animals’. In this simple example the word “eat” has appeared in a sentence dominated by Topic A, but also in a sentence with some association to Topic B. Therefore it can also be seen as a connector of the two topics. Of course animals eat too and they like food!

We are going to use a similar approach to first extract the main topics reflected on the reports to the Everyday Sexism Project website and extract the relation between the sexism-related topics and concepts based on the overlap between the bags of words of each topic. Finally we can also look into the co-appearance of topics in the same document.  This way we try to draw a linguistic picture of the more than 100,000 submitted reports.

As ever, be sure to check back for further updates on our progress!

How big data is breathing new life into the smart cities concept

“Big data” is a growing area of interest for public policy makers: for example, it was highlighted in UK Chancellor George Osborne’s recent budget speech as a major means of improving efficiency in public service delivery. While big data can apply to government at every level, the majority of innovation is currently being driven by local government, especially cities, who perhaps have greater flexibility and room to experiment and who are constantly on a drive to improve service delivery without increasing budgets.

Work on big data for cities is increasingly incorporated under the rubric of “smart cities”. The smart city is an old(ish) idea: give urban policymakers real time information on a whole variety of indicators about their city (from traffic and pollution to park usage and waste bin collection) and they will be able to improve decision making and optimise service delivery. But the initial vision, which mostly centred around adding sensors and RFID tags to objects around the city so that they would be able to communicate, has thus far remained unrealised (big up front investment needs and the requirements of IPv6 are perhaps the most obvious reasons for this).

The rise of big data – large, heterogeneous datasets generated by the increasing digitisation of social life – has however breathed new life into the smart cities concept. If all the cars have GPS devices, all the people have mobile phones, and all opinions are expressed on social media, then do we really need the city to be smart at all? Instead, policymakers can simply extract what they need from a sea of data which is already around them. And indeed, data from mobile phone operators has already been used for traffic optimisation, Oyster card data has been used to plan London Underground service interruptions, sewage data has been used to estimate population levels … the examples go on.

However, at the moment these examples remain largely anecdotal, driven forward by a few cities rather than adopted worldwide. The big data driven smart city faces considerable challenges if it is to become a default means of policymaking rather than a conversation piece. Getting access to the right data; correcting for biases and inaccuracies (not everyone has a GPS, phone, or expresses themselves on social media); and communicating it all to executives remain key concerns. Furthermore, especially in a context of tight budgets, most local governments cannot afford to experiment with new techniques which may not pay off instantly.

This is the context of two current OII projects in the smart cities field: UrbanData2Decide (2014-2016) and NEXUS (2015-2017). UrbanData2Decide joins together a consortium of European universities, each working with a local city partner, to explore how local government problems can be resolved with urban generated data. In Oxford, we are looking at how open mapping data can be used to estimate alcohol availability; how website analytics can be used to estimate service disruption; and how internal administrative data and social media data can be used to estimate population levels. The best concepts will be built into an application which allows decision makers to access these concepts real time.

NEXUS builds on this work. A collaborative partnership with BT, it will look at how social media data and some internal BT data can be used to estimate people movement and traffic patterns around the city, joining these data into network visualisations which are then displayed to policymakers in a data visualisation application. Both projects fill an important gap by allowing city officials to experiment with data driven solutions, providing proof of concepts and showing what works and what doesn’t. Increasing academic-government partnerships in this way has real potential to drive forward the field and turn the smart city vision into a reality.


OII Resarch Fellow Jonathan Bright is a political scientist specialising in computational and ‘big data’ approaches to the social sciences. His major interest concerns studying how people get information about the political process, and how this is changing in the internet era.

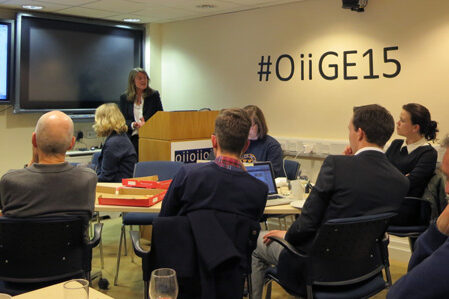
Digital Disconnect: Parties, Pollsters and Political Analysis in #GE2015

We undertook some live analysis of social media data over the night of the 2015 UK General Election. See more photos from the OII's election night party, or read about the data hack
The Oxford Internet Institute undertook some live analysis of social media data over the night of the 2015 UK General Election. See more photos from the OII’s election night party, or read about the data hack

Counts of public Facebook posts mentioning any of the party leaders’ surnames. Data generated by social media can be used to understand political behaviour and institutions on an ongoing basis.[/caption]‘Congratulations to my friend @Messina2012 on his role in the resounding Conservative victory in Britain’ tweeted David Axelrod, campaign advisor to Miliband, to his former colleague Jim Messina, Cameron’s strategy adviser, on May 8th. The former was Obama’s communications director and the latter campaign manager of Obama’s 2012 campaign. Along with other consultants and advisors and large-scale data management platforms from Obama’s hugely successful digital campaigns, Conservative and Labour used an arsenal of social media and digital tools to interact with voters throughout, as did all the parties competing for seats in the 2015 election.

The parties ran very different kinds of digital campaigns. The Conservatives used advanced data science techniques borrowed from the US campaigns to understand how their policy announcements were being received and to target groups of individuals. They spent ten times as much as Labour on Facebook, using ads targeted at Facebook users according to their activities on the platform, geo-location and demographics. This was a top down strategy that involved working out was happening on social media and responding with targeted advertising, particularly for marginal seats. It was supplemented by the mainstream media, such as the Telegraph for example, which contacted its database of readers and subscribers to services such as Telegraph Money, urging them to vote Conservative. As Andrew Cooper tweeted after the election, ‘Big data, micro-targeting and social media campaigns just thrashed “5 million conversations” and “community organizing”’.

He has a point. Labour took a different approach to social media. Widely acknowledged to have the most boots on the real ground, knocking on doors, they took a similar ‘ground war’ approach to social media in local campaigns. Our own analysis at the Oxford Internet Institute shows that of the 450K tweets sent by candidates of the six largest parties in the month leading up to the general election, Labour party candidates sent over 120,000 while the Conservatives sent only 80,000, no more than the Greens and not much more than UKIP. But the greater number of Labour tweets were no more productive in terms of impact (measured in terms of mentions generated: and indeed the final result).

Both parties’ campaigns were tightly controlled. Ostensibly, Labour generated far more bottom-up activity from supporters using social media, through memes like #votecameron out, #milibrand (responding to Miliband’s interview with Russell Brand), and what Miliband himself termed the most unlikely cult of the 21st century in his resignation speech, #milifandom, none of which came directly from Central Office. These produced peaks of activity on Twitter that at some points exceeded even discussion of the election itself on the semi-official #GE2015 used by the parties, as the figure below shows. But the party remained aloof from these conversations, fearful of mainstream media mockery.

The Brand interview was agreed to out of desperation and can have made little difference to the vote (partly because Brand endorsed Miliband only after the deadline for voter registration: young voters suddenly overcome by an enthusiasm for participatory democracy after Brand’s public volte face on the utility of voting will have remained disenfranchised). But engaging with the swathes of young people who spend increasing amounts of their time on social media is a strategy for engagement that all parties ought to consider. YouTubers like PewDiePie have tens of millions of subscribers and billions of video views – their videos may seem unbelievably silly to many, but it is here that a good chunk the next generation of voters are to be found.

Use of emergent hashtags on Twitter during the 2015 General Election. Volumes are estimates based on a 10% sample with the exception of #ge2015, which reflects the exact value. All data from Datasift.

Only one of the leaders had a presence on social media that managed anything like the personal touch and universal reach that Obama achieved in 2008 and 2012 based on sustained engagement with social media – Nicola Sturgeon. The SNP’s use of social media, developed in last September’s referendum on Scottish independence had spawned a whole army of digital activists. All SNP candidates started the campaign with a Twitter account. When we look at the 650 local campaigns waged across the country, by far the most productive in the sense of generating mentions was the SNP; 100 tweets from SNP local candidates generating 10 times more mentions (1,000) than 100 tweets from (for example) the Liberal Democrats.

Scottish Labour’s failure to engage with Scottish peoples in this kind of way illustrates how difficult it is to suddenly develop relationships on social media – followers on all platforms are built up over years, not in the short space of a campaign. In strong contrast, advertising on these platforms as the Conservatives did is instantaneous, and based on the data science understanding (through advertising algorithms) of the platform itself. It doesn’t require huge databases of supporters – it doesn’t build up relationships between the party and supporters – indeed, they may remain anonymous to the party. It’s quick, dirty and effective.

The pollsters’ terrible night

So neither of the two largest parties really did anything with social media, or the huge databases of interactions that their platforms will have generated, to generate long-running engagement with the electorate. The campaigns were disconnected from their supporters, from their grass roots.

But the differing use of social media by the parties could lend a clue to why the opinion polls throughout the campaign got it so wrong, underestimating the Conservative lead by an average of five per cent. The social media data that may be gathered from this or any campaign is a valuable source of information about what the parties are doing, how they are being received, and what people are thinking or talking about in this important space – where so many people spend so much of their time. Of course, it is difficult to read from the outside; Andrew Cooper labeled the Conservatives’ campaign of big data to identify undecided voters, and micro-targeting on social media, as ‘silent and invisible’ and it seems to have been so to the polls.

Many voters were undecided until the last minute, or decided not to vote, which is impossible to predict with polls (bar the exit poll) – but possibly observable on social media, such as the spikes in attention to UKIP on Wikipedia towards the end of the campaign, which may have signaled their impressive share of the vote. As Jim Messina put it to msnbc news following up on his May 8th tweet that UK (and US) polling was ‘completely broken’ – ‘people communicate in different ways now’, arguing that the Miliband campaign had tried to go back to the 1970s.

Surveys – such as polls — give a (hopefully) representative picture of what people think they might do. Social media data provide an (unrepresentative) picture of what people really said or did. Long-running opinion surveys (such as the Ipsos MORI Issues Index) can monitor the hopes and fears of the electorate in between elections, but attention tends to focus on the huge barrage of opinion polls at election time – which are geared entirely at predicting the election result, and which do not contribute to more general understanding of voters. In contrast, social media are a good way to track rapid bursts in mobilization or support, which reflect immediately on social media platforms – and could also be developed to illustrate more long running trends, such as unpopular policies or failing services.

As opinion surveys face more and more challenges, there is surely good reason to supplement them with social media data, which reflect what people are really thinking on an ongoing basis – like, a video in rather than the irregular snapshots taken by polls. As a leading pollster João Francisco Meira, director of Vox Populi in Brazil (which is doing innovative work in using social media data to understand public opinion) put it in conversation with one of the authors in April – ‘we have spent so long trying to hear what people are saying – now they are crying out to be heard, every day’. It is a question of pollsters working out how to listen.

Political big data

Analysts of political behaviour – academics as well as pollsters — need to pay attention to this data. At the OII we gathered large quantities of data from Facebook, Twitter, Wikipedia and YouTube in the lead-up to the election campaign, including mentions of all candidates (as did Demos’s Centre for the Analysis of Social Media). Using this data we will be able, for example, to work out the relationship between local social media campaigns and the parties’ share of the vote, as well as modeling the relationship between social media presence and turnout.

We can already see that the story of the local campaigns varied enormously – while at the start of the campaign some candidates were probably requesting new passwords for their rusty Twitter accounts, some already had an ongoing relationship with their constituents (or potential constituents), which they could build on during the campaign. One of the candidates to take over the Labour party leadership, Chuka Umunna, joined Twitter in April 2009 and now has 100K followers, which will be useful in the forthcoming leadership contest.

Election results inject data into a research field that lacks ‘big data’. Data hungry political scientists will analyse these data in every way imaginable for the next five years. But data in between elections, for example relating to democratic or civic engagement or political mobilization, has traditionally been woefully short in our discipline. Analysis of the social media campaigns in #GE2015 will start to provide a foundation to understand patterns and trends in voting behaviour, particularly when linked to other sources of data, such as the actual constituency-level voting results and even discredited polls — which may yet yield insight, even having failed to achieve their predictive aims. As the OII’s Jonathan Bright and Taha Yasseri have argued, we need ‘a theory-informed model to drive social media predictions, that is based on an understanding of how the data is generated and hence enables us to correct for certain biases’

A political data science

Parties, pollsters and political analysts should all be thinking about these digital disconnects in #GE2015, rather than burying them with their hopes for this election. As I argued in a previous post, let’s use data generated by social media to understand political behaviour and institutions on an ongoing basis. Let’s find a way of incorporating social media analysis into polling models, for example by linking survey datasets to big data of this kind. The more such activity moves beyond the election campaign itself, the more useful social media data will be in tracking the underlying trends and patterns in political behavior.

And for the parties, these kind of ways of understanding and interacting with voters needs to be institutionalized in party structures, from top to bottom. On 8th May, the VP of a policy think-tank tweeted to both Axelrod and Messina ‘Gentlemen, welcome back to America. Let’s win the next one on this side of the pond’. The UK parties are on their own now. We must hope they use the time to build an ongoing dialogue with citizens and voters, learning from the success of the new online interest group barons, such as 38 degrees and Avaaz, by treating all internet contacts as ‘members’ and interacting with them on a regular basis. Don’t wait until 2020!


Helen Margetts is the Director of the OII, and Professor of Society and the Internet. She is a political scientist specialising in digital era governance and politics, investigating political behaviour, digital government and government-citizen interactions in the age of the internet, social media and big data. She has published over a hundred books, articles and major research reports in this area, including Political Turbulence: How Social Media Shape Collective Action (with Peter John, Scott Hale and Taha Yasseri, 2015).

Scott A. Hale is a Data Scientist at the OII. He develops and applies techniques from computer science to research questions in the social sciences. He is particularly interested in the area of human-computer interaction and the spread of information between speakers of different languages online and the roles of bilingual Internet users. He is also interested in collective action and politics more generally.

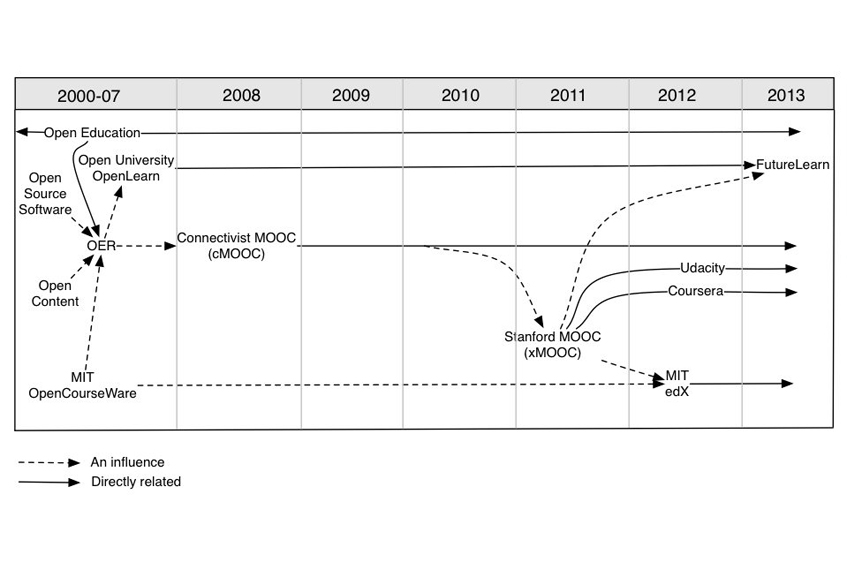
Two years after the NYT’s ‘Year of the MOOC’: how much do we actually know about them?

Timeline of the development of MOOCs and open education
Timeline of the development of MOOCs and open education, from: Yuan, Li, and Stephen Powell. MOOCs and Open Education: Implications for Higher Education White Paper. University of Bolton: CETIS, 2013.

Ed: Does research on MOOCs differ in any way from existing research on online learning?

Rebecca: Despite the hype around MOOCs to date, there are many similarities between MOOC research and the breadth of previous investigations into (online) learning. Many of the trends we’ve observed (the prevalence of forum lurking; community formation; etc.) have been studied previously and are supported by earlier findings. That said, the combination of scale, global-reach, duration, and “semi-synchronicity” of MOOCs have made them different enough to inspire this work. In particular, the optional nature of participation among a global-body of lifelong learners for a short burst of time (e.g. a few weeks) is a relatively new learning environment that, despite theoretical ties to existing educational research, poses a new set of challenges and opportunities.

Ed: The MOOC forum networks you modelled seemed to be less efficient at spreading information than randomly generated networks. Do you think this inefficiency is due to structural constraints of the system (or just because inefficiency is not selected against); or is there something deeper happening here, maybe saying something about the nature of learning, and networked interaction?

Rebecca: First off, it’s important to not confuse the structural “inefficiency” of communication with some inherent learning “inefficiency”. The inefficiency in the sub-forums is a matter of information diffusion—i.e., because there are communities that form in the discussion spaces, these communities tend to “trap” knowledge and information instead of promoting the spread of these ideas to a vast array of learners. This information diffusion inefficiency is not necessarily a bad thing, however. It’s a natural human tendency to form communities, and there is much education research that says learning in small groups can be much more beneficial / effective than large-scale learning. The important point that our work hopes to make is that the existence and nature of these communities seems to be influenced by the types of topics that are being discussed (and vice versa)—and that educators may be able to cultivate more isolated or inclusive network dynamics in these course settings by carefully selecting and presenting these different discussion topics to learners.

Ed: Drawing on surveys and learning outcomes you could categorise four ‘learner types’, who tend to behave differently in the network. Could the network be made more efficient by streaming groups by learning objective, or by type of interaction (eg learning / feedback / social)?

Rebecca: Given our network vulnerability analysis, it appears that discussions that focus on problems or issues that are based in real life examples –e.g., those that relate to case studies of real companies and analyses posted by learners of these companies—tend to promote more inclusive engagement and efficient information diffusion. Given that certain types of learners participate in these discussions, one could argue that forming groups around learning preferences and objectives could promote more efficient communications. Still, it’s important to be aware of the potential drawbacks to this, namely, that promoting like-minded / similar people to interact with those they are similar to could further prevent “learning through diverse exposures” that these massive-scale settings can be well-suited to promote.

Ed: In the classroom, the teacher can encourage participation and discussion if it flags: are there mechanisms to trigger or seed interaction if the levels of network activity fall below a certain threshold? How much real-time monitoring tends to occur in these systems?

Rebecca: Yes, it appears that educators may be able to influence or achieve certain types of network patterns. While each MOOC is different (some course staff members tend to be much more engaged than others, learners may have different motivations, etc.), on the whole, there isn’t much real-time monitoring in MOOCs, and MOOC platforms are still in early days where there is little to no automated monitoring or feedback (beyond static analytics dashboards for instructors).

Ed: Does learner participation in these forums improve outcomes? Do the most central users in the interaction network perform better? And do they tend to interact with other very central people?

Rebecca: While we can’t infer causation, we found that when compared to the entire course, a significantly higher percentage of high achievers were also forum participants. The more likely explanation for this is that those who are committed to completing the course and performing well also tend to use the forums—but the plurality of forum participants (44% in one of the courses we analyzed) are actually those that “fail” by traditional marks (receive below 50% in the course). Indeed, many central users tend to be those that are simply auditing the course or who are interested in communicating with others without any intention of completing course assignments. These central users tend to communicate with other central users, but also, with those whose participation is much sparser / “on the fringes”.

Ed: Slightly facetiously: you can identify ‘central’ individuals in the network who spark and sustain interaction. Can you also find people who basically cause interaction to die? Who will cause the network to fall apart? And could you start to predict the strength of a network based on the profiles and proportions of the individuals who make it up?

Rebecca: It is certainly possible to further explore how different people seem. One way this can be achieved is by exploring the temporal dynamics at play—e.g., by visualizing the communication network at any point in time and creating network “snapshots” at every hour or day, or perhaps, with every new participant, to observe how the trends and structures evolve. While this method still doesn’t allow us to identify the exact influence of any given individual’s participation (since there are so many other confounding factors, for example, how far into the course it is, peoples’ schedules / lives outside of the MOOC, etc.), it may provide some insight into their roles. We could of course define some quantitative measure(s) to measure “network strength” based on learner profiles, but caution against overarching or broad claims in doing so due to confounding forces would be essential.

Ed: The majority of my own interactions are mediated by a keyboard: which is actually a pretty inefficient way of communicating, and certainly a terrible way of arguing through a complex point. Is there any sense from MOOCs that text-based communication might be a barrier to some forms of interaction, or learning?

Rebecca: This is an excellent observation. Given the global student body, varying levels of comfort in English (and written language more broadly), differing preferences for communication, etc., there is much reason to believe that a lack of participation could result from a lack of comfort with the keyboard (or written communication more generally). Indeed, in the MOOCs we’ve studied, many learners have attempted to meet up on Google Hangouts or other non-text based media to form and sustain study groups, suggesting that many learners seek to use alternative technologies to interact with others and achieve their learning objectives.

Ed: Based on this data and analysis, are there any obvious design points that might improve interaction efficiency and learning outcomes in these platforms?

Rebecca: As I have mentioned already, open-ended questions that focus on real-life case studies tend to promote the least vulnerable and most “efficient” discussions, which may be of interest to practitioners looking to cultivate these sorts of environments. More broadly, the lack of sustained participation in the forums suggests that there are a number of “forces of disengagement” at play, one of them being that the sheer amount of content being generated in the discussion spaces (one course had over 2,700 threads and 15,600 posts) could be contributing to a sense of “content overload” and helplessness for learners. Designing platforms that help mitigate this problem will be fundamental to the vitality and effectiveness of these learning spaces in the future.

Ed: I suppose there is an inherent tension between making the online environment very smooth and seductive, and the process of learning; which is often difficult and frustrating: the very opposite experience aimed for (eg) by games designers. How do MOOCs deal with this tension? (And how much gamification is common to these systems, if any?)

Rebecca: To date, gamification seems to have been sparse in most MOOCs, although there are some interesting experiments in the works. Indeed, one study (Anderson et al., 2014) used a randomized control trial to add badges (that indicate student engagement levels) next to the names of learners in MOOC discussion spaces in order to determine if and how this affects further engagement. Coursera has also started to publicly display badges next to the names of learners that have signed up for the paid Signature Track of a specific course (presumably, to signal which learners are “more serious” about completing the course than others). As these platforms become more social (and perhaps career advancement-oriented), it’s quite possible that gamification will become more popular. This gamification may not ease the process of learning or make it more comfortable, but rather, offer additional opportunities to mitigate the challenges massive-scale anonymity and lack of information about peers to facilitate more social learning.

Ed: How much of this work is applicable to other online environments that involve thousands of people exploring and interacting together: for example deliberation, crowd production and interactive gaming, which certainly involve quantifiable interactions and a degree of negotiation and learning?

Rebecca: Since MOOCs are so loosely structured and could largely be considered “informal” learning spaces, we believe the engagement dynamics we’ve found could apply to a number of other large-scale informal learning/interactive spaces online. Similar crowd-like structures can be found in a variety of policy and practice settings.

Ed: This project has adopted a mixed methods approach: what have you gained by this, and how common is it in the field?

Rebecca: Combining computational network analysis and machine learning with qualitative content analysis and in-depth interviews has been one of the greatest strengths of this work, and a great learning opportunity for the research team. Often in empirical research, it is important to validate findings across a variety of methods to ensure that they’re robust. Given the complexity of human subjects, we knew computational methods could only go so far in revealing underlying trends; and given the scale of the dataset, we knew there were patterns that qualitative analysis alone would not enable us to detect. A mixed-methods approach enabled us to simultaneously and robustly address these dimensions. MOOC research to date has been quite interdisciplinary, bringing together computer scientists, educationists, psychologists, statisticians, and a number of other areas of expertise into a single domain. The interdisciplinarity of research in this field is arguably one of the most exciting indicators of what the future might hold.

Ed: As well as the network analysis, you also carried out interviews with MOOC participants. What did you learn from them that wasn’t obvious from the digital trace data?

Rebecca: The interviews were essential to this investigation. In addition to confirming the trends revealed by our computational explorations (which revealed the what of the underlying dynamics at play), the interviews, revealed much of the why. In particular, we learned people’s motivations for participating in (or disengaging from) the discussion forums, which provided an important backdrop for subsequent quantitative (and qualitative) investigations. We have also learned a lot more about people’s experiences of learning, the strategies they employ to their support their learning and issues around power and inequality in MOOCs.

Ed: You handcoded more than 6000 forum posts in one of the MOOCs you investigated. What findings did this yield? How would you characterise the learning and interaction you observed through this content analysis?

Rebecca: The qualitative content analysis of over 6,500 posts revealed several key insights. For one, we confirmed (as the network analysis suggested), that most discussion is insignificant “noise”—people looking to introduce themselves or have short-lived discussions about topics that are beyond the scope of the course. In a few instances, however, we discovered the different patterns (and sometimes, cycles) of knowledge construction that can occur within a specific discussion thread. In some cases, we found that discussion threads grew to be so long (with over hundreds of posts), that topics were repeated or earlier posts disregarded because new participants didn’t read and/or consider them before adding their own replies.

Ed: How are you planning to extend this work?

Rebecca: As mentioned already, feelings of helplessness resulting from sheer “content overload” in the discussion forums appear to be a key force of disengagement. To that end, as we now have a preliminary understanding of communication dynamics and learner tendencies within these sorts of learning environments, we now hope to leverage this background knowledge to develop new methods for promoting engagement and the fulfilment of individual learning objectives in these settings—in particular, by trying to mitigate the “content overload” issues in some way. Stay tuned for updates 🙂

References

Anderson, A., Huttenlocher, D., Kleinberg, J. & Leskovec, J., Engaging with Massive Open Online Courses.  In: WWW ’14 Proceedings of the 23rd International World Wide Web Conference, Seoul, Korea. New York: ACM (2014).

Read the full paper: Gillani, N., Yasseri, T., Eynon, R., and Hjorth, I. (2014) Structural limitations of learning in a crowd – communication vulnerability and information diffusion in MOOCs. Scientific Reports 4.


Rebecca Eynon was talking to blog editor David Sutcliffe.

Rebecca Eynon holds a joint academic post between the Oxford Internet Institute (OII) and the Department of Education at the University of Oxford. Her research focuses on education, learning and inequalities, and she has carried out projects in a range of settings (higher education, schools and the home) and life stages (childhood, adolescence and late adulthood).

What are the limitations of learning at scale? Investigating information diffusion and network vulnerability in MOOCs

Millions of people worldwide are currently enrolled in courses provided on large-scale learning platforms (aka ‘MOOCs’), typically collaborating in online discussion forums with thousands of peers. Current learning theory emphasizes the importance of this group interaction for cognition. However, while a lot is known about the mechanics of group learning in smaller and traditionally organized online classrooms, fewer studies have examined participant interactions when learning “at scale”. Some studies have used clickstream data to trace participant behaviour; even predicting dropouts based on their engagement patterns. However, many questions remain about the characteristics of group interactions in these courses, highlighting the need to understand whether — and how — MOOCs allow for deep and meaningful learning by facilitating significant interactions.

But what constitutes a “significant” learning interaction? In large-scale MOOC forums, with socio-culturally diverse learners with different motivations for participating, this is a non-trivial problem. MOOCs are best defined as “non-formal” learning spaces, where learners pick and choose how (and if) they interact. This kind of group membership, together with the short-term nature of these courses, means that relatively weak inter-personal relationships are likely. Many of the tens of thousands of interactions in the forum may have little relevance to the learning process. So can we actually define the underlying network of significant interactions? Only once we have done this can we explore firstly how information flows through the forums, and secondly the robustness of those interaction networks: in short, the effectiveness of the platform design for supporting group learning at scale.

To explore these questions, we analysed data from 167,000 students registered on two business MOOCs offered on the Coursera platform. Almost 8000 students contributed around 30,000 discussion posts over the six weeks of the courses; almost 30,000 students viewed at least one discussion thread, totalling 321,769 discussion thread views. We first modelled these communications as a social network, with nodes representing students who posted in the discussion forums, and edges (ie links) indicating co-participation in at least one discussion thread. Of course, not all links will be equally important: many exchanges will be trivial (‘hello’, ‘thanks’ etc.). Our task, then, was to derive a “true” network of meaningful student interactions (ie iterative, consistent dialogue) by filtering out those links generated by random encounters (Figure 1; see also full paper for methodology).

Figure 1. Comparison of observed (a; ‘all interactions’) and filtered (b; ‘significant interactions’) communication networks for a MOOC forum. Filtering affects network properties such as modularity score (ie degree of clustering). Colours correspond to the automatically detected interest communities.
One feature of networks that has been studied in many disciplines is their vulnerability to fragmentation when nodes are removed (the Internet, for example, emerged from US Army research aiming to develop a disruption-resistant network for critical communications). While we aren’t interested in the effect of missile strike on MOOC exchanges, from an educational perspective it is still useful to ask which “critical set” of learners is mostly responsible for information flow in a communication network — and what would happen to online discussions if these learners were removed. To our knowledge, this is the first time vulnerability of communication networks has been explored in an educational setting.

Network vulnerability is interesting because it indicates how integrated and inclusive the communication flow is. Discussion forums with fleeting participation will have only a very few vocal participants: removing these people from the network will markedly reduce the information flow between the other participants — as the network falls apart, it simply becomes more difficult for information to travel across it via linked nodes. Conversely, forums that encourage repeated engagement and in-depth discussion among participants will have a larger ‘critical set’, with discussion distributed across a wide range of learners.

To understand the structure of group communication in the two courses, we looked at how quickly our modelled communication network fell apart when: (a) the most central nodes were iteratively disconnected (Figure 2; blue), compared with when (b) nodes were removed at random (ie the ‘neutral’ case; green). In the random case, the network degrades evenly, as expected. When we selectively remove the most central nodes, however, we see rapid disintegration: indicating the presence of individuals who are acting as important ‘bridges’ across the network. In other words, the network of student interactions is not random: it has structure.

Figure 2. Rapid network degradation results from removal of central nodes (blue). This indicates the presence of individuals acting as ‘bridges’ between sub-groups. Removing these bridges results in rapid degradation of the overall network. Removal of random nodes (green) results in a more gradual degradation.

Of course, the structure of participant interactions will reflect the purpose and design of the particular forum. We can see from Figure 3 that different forums in the courses have different vulnerability thresholds. Forums with high levels of iterative dialogue and knowledge construction — with learners sharing ideas and insights about weekly questions, strategic analyses, or course outcomes — are the least vulnerable to degradation. A relatively high proportion of nodes have to be removed before the network falls apart (rightmost-blue line). Forums where most individuals post once to introduce themselves and then move their discussions to other platforms (such as Facebook) or cease engagement altogether tend to be more vulnerable to degradation (left-most blue line). The different vulnerability thresholds suggest that different topics (and forum functions) promote different levels of forum engagement. Certainly, asking students open-ended questions tended to encourage significant discussions, leading to greater engagement and knowledge construction as they read analyses posted by their peers and commented with additional insights or critiques.

Figure 3 – Network vulnerabilities of different course forums.

Understanding something about the vulnerability of a communication or interaction network is important, because it will tend to affect how information spreads across it. To investigate this, we simulated an information diffusion model similar to that used to model social contagion. Although simplistic, the SI model (‘susceptible-infected’) is very useful in analyzing topological and temporal effects on networked communication systems. While the model doesn’t account for things like decaying interest over time or peer influence, it allows us to compare the efficiency of different network topologies.

We compared our (real-data) network model with a randomized network in order to see how well information would flow if the community structures we observed in Figure 2 did not exist. Figure 4 shows the number of ‘infected’ (or ‘reached’) nodes over time for both the real (solid lines) and randomized networks (dashed lines). In all the forums, we can see that information actually spreads faster in the randomised networks. This is explained by the existence of local community structures in the real-world networks: networks with dense clusters of nodes (i.e. a clumpy network) will result in slower diffusion than a network with a more even distribution of communication, where participants do not tend to favor discussions with a limited cohort of their peers.

Figure 4 (a) shows the percentage of infected nodes vs. simulation time for different networks. The solid lines show the results for the original network and the dashed lines for the random networks. (b) shows the time it took for a simulated “information packet” to come into contact with half the network’s nodes.

Overall, these results reveal an important characteristic of student discussion in MOOCs: when it comes to significant communication between learners, there are simply too many discussion topics and too much heterogeneity (ie clumpiness) to result in truly global-scale discussion. Instead, most information exchange, and by extension, any knowledge construction in the discussion forums occurs in small, short-lived groups: with information “trapped” in small learner groups. This finding is important as it highlights structural limitations that may impact the ability of MOOCs to facilitate communication amongst learners that look to learn “in the crowd”.

These insights into the communication dynamics motivate a number of important questions about how social learning can be better supported, and facilitated, in MOOCs. They certainly suggest the need to leverage intelligent machine learning algorithms to support the needs of crowd-based learners; for example, in detecting different types of discussion and patterns of engagement during the runtime of a course to help students identify and engage in conversations that promote individualized learning. Without such interventions the current structural limitations of social learning in MOOCs may prevent the realization of a truly global classroom.

The next post addresses qualitative content analysis and how machine-learning community detection schemes can be used to infer latent learner communities from the content of forum posts.

Read the full paper: Gillani, N., Yasseri, T., Eynon, R., and Hjorth, I. (2014) Structural limitations of learning in a crowd – communication vulnerability and information diffusion in MOOCs. Scientific Reports 4.


Rebecca Eynon holds a joint academic post between the Oxford Internet Institute (OII) and the Department of Education at the University of Oxford. Her research focuses on education, learning and inequalities, and she has carried out projects in a range of settings (higher education, schools and the home) and life stages (childhood, adolescence and late adulthood).

The life and death of political news: using online data to measure the impact of the audience agenda

Caption
Image of the Telegraph’s state of the art “hub and spoke” newsroom layout by David Sim.
The political agenda has always been shaped by what the news media decide to publish — through their ability to broadcast to large, loyal audiences in a sustained manner, news editors have the ability to shape ‘political reality’ by deciding what is important to report. Traditionally, journalists pass to their editors from a pool of potential stories; editors then choose which stories to publish. However, with the increasing importance of online news, editors must now decide not only what to publish and where, but how long it should remain prominent and visible to the audience on the front page of the news website.

The question of how much influence the audience has in these decisions has always been ambiguous. While in theory we might expect journalists to be attentive to readers, journalism has also been characterized as a profession with a “deliberate…ignorance of audience wants” (Anderson, 2011b). This ‘anti-populism’ is still often portrayed as an important journalistic virtue, in the context of telling people what they need to hear, rather than what they want to hear. Recently, however, attention has been turning to the potential impact that online audience metrics are having on journalism’s “deliberate ignorance”. Online publishing provides a huge amount of information to editors about visitor numbers, visit frequency, and what visitors choose to read and how long they spend reading it. Online editors now have detailed information about what articles are popular almost as soon as they are published, with these statistics frequently displayed prominently in the newsroom.

The rise of audience metrics has created concern both within the journalistic profession and academia, as part of a broader set of concerns about the way journalism is changing online. Many have expressed concern about a ‘culture of click’, whereby important but unexciting stories make way for more attention grabbing pieces, and editorial judgments are overridden by traffic statistics. At a time when media business models are under great strain, the incentives to follow the audience are obvious, particularly when business models increasingly rely on revenue from online traffic and advertising. The consequences for the broader agenda-setting function of the news media could be significant: more prolific or earlier readers might play a disproportionate role in helping to select content; particular social classes or groupings that read news online less frequently might find their issues being subtly shifted down the agenda.

The extent to which such a populist influence exists has attracted little empirical research. Many ethnographic studies have shown that audience metrics are being captured in online newsrooms, with anecdotal evidence for the importance of traffic statistics on an article’s lifetime (Anderson 2011b, MacGregor, 2007). However, many editors have emphasised that popularity is not a major determining factor (MacGregor, 2007), and that news values remain significant in terms of placement of news articles.

In order to assess the possible influence of audience metrics on decisions made by political news editors, we undertook a systematic, large-scale study of the relationship between readership statistics and article lifetime. We examined the news cycles of five major UK news outlets (the BBC, the Daily Telegraph, the Guardian, the Daily Mail and the Mirror) over a period of six weeks, capturing their front pages every 15 minutes, resulting in over 20,000 front-page captures and more than 40,000 individual articles. We measure article readership by capturing information from the BBC’s “most read” list of news articles (twelve percent of the articles were featured at some point on the ‘most read’ list, with a median time to achieving this status of two hours, and an average article life of 15 hours on the front page). Using the Cox Proportional Hazards model (which allows us to quantify the impact of an article’s appearance on the ‘most read’ list on its chance of survival) we asked whether an article’s being listed in a ‘most read’ column affected the length of time it remained on the front page.

We found that ‘most read’ articles had, on average, a 26% lower chance of being removed from the front page than equivalent articles which were not on the most read list, providing support for the idea that online editors are influenced by readership statistics. In addition to assessing the general impact of readership statistics, we also wanted to see whether this effect differs between ‘political’ and ‘entertainment’ news. Research on participatory journalism has suggested that online editors might be more willing to allow audience participation in areas of soft news such as entertainment, arts, sports, etc. We find a small amount of evidence for this claim, though the difference between the two categories was very slight.

Finally, we wanted to assess whether there is a ‘quality’ / ‘tabloid’ split. Part of the definition of tabloid style journalism lies precisely in its willingness to follow the demands of its audience. However, we found the audience ‘effect’ (surprisingly) to be most obvious in the quality papers. For tabloids, ‘most read’ status actually had a slightly negative effect on article lifetime. We wouldn’t argue that tabloid editors actively reject the wishes of their audience; however we can say that these editors are no more likely to follow their audience than the typical ‘quality’ editor, and in fact may be less so. We do not have a clear explanation for this difference, though we could speculate that, as tabloid publications are already more tuned in to the wishes of their audience, the appearance of readership statistics makes less practical difference to the overall product. However it may also simply be the case that the online environment is slowly producing new journalistic practices for which the tabloid / quality distinction will be of less usefulness.

So on the basis of our study, we can say that high-traffic articles do in fact spend longer in the spotlight than ones that attract less readership: audience readership does have a measurable impact on the lifespan of political news. The audience is no longer the unknown quantity it was in offline journalism: it appears to have a clear impact on journalistic practice. The question that remains, however, is whether this constitutes evidence of a new ‘populism’ in journalism; or whether it represents (as editors themselves have argued) the simple striking of a balance between audience demands and news values.

Read the full article: Bright, J., and Nicholls, T. (2014) The Life and Death of Political News: Measuring the Impact of the Audience Agenda Using Online Data. Social Science Computer Review 32 (2) 170-181.

References

Anderson, C. W. (2011) Between creative and quantified audiences: Web metrics and changing patterns of newswork in local US newsrooms. Journalism 12 (5) 550-566.

MacGregor, P. (2007) Tracking the Online Audience. Journalism Studies 8 (2) 280-298.


OII Resarch Fellow Jonathan Bright is a political scientist specialising in computational and ‘big data’ approaches to the social sciences. His major interest concerns studying how people get information about the political process, and how this is changing in the internet era.

Tom Nicholls is a doctoral student at the Oxford Internet Institute. His research interests include the impact of technology on citizen/government relationships, the Internet’s implications for public management and models of electronic public service delivery.

How easy is it to research the Chinese web?

Chinese Internet Cafe
Access to data from the Chinese Web, like other Web data, depends on platform policies, the level of data openness, and the availability of data intermediary and tools. Image of a Chinese Internet cafe by Hal Dick.

Ed: How easy is it to request or scrape data from the “Chinese Web”? And how much of it is under some form of government control?

Han-Teng: Access to data from the Chinese Web, like other Web data, depends on the policies of platforms, the level of data openness, and the availability of data intermediary and tools. All these factors have direct impacts on the quality and usability of data. Since there are many forms of government control and intentions, increasingly not just the websites inside mainland China under Chinese jurisdiction, but also the Chinese “soft power” institutions and individuals telling the “Chinese story” or “Chinese dream” (as opposed to “American dreams”), it requires case-by-case research to determine the extent and level of government control and interventions. Based on my own research on Chinese user-generated encyclopaedias and Chinese-language twitter and Weibo, the research expectations seem to be that control and intervention by Beijing will be most likely on political and cultural topics, not likely on economic or entertainment ones.

This observation is linked to how various forms of government control and interventions are executed, which often requires massive data and human operations to filter, categorise and produce content that are often based on keywords. It is particularly true for Chinese websites in mainland China (behind the Great Firewall, excluding Hong Kong and Macao), where private website companies execute these day-to-day operations under the directives and memos of various Chinese party and government agencies.

Of course there is some extra layer of challenges if researchers try to request content and traffic data from the major Chinese websites for research, especially regarding censorship. Nonetheless, since most Web content data is open, researchers such as Professor Fu in Hong Kong University manage to scrape data sample from Weibo, helping researchers like me to access the data more easily. These openly collected data can then be used to measure potential government control, as has been done for previous research on search engines (Jiang and Akhtar 2011; Zhu et al. 2011) and social media (Bamman et al. 2012; Fu et al. 2013; Fu and Chau 2013; King et al. 2012; Zhu et al. 2012).

It follows that the availability of data intermediary and tools will become important for both academic and corporate research. Many new “public opinion monitoring” companies compete to provide better tools and datasets as data intermediaries, including the Online Public Opinion Monitoring and Measuring Unit (人民网舆情监测室) of the People’s Net (a Party press organ) with annual revenue near 200 million RMB. Hence, in addition to the on-going considerations on big data and Web data research, we need to factor in how these private and public Web data intermediaries shape the Chinese Web data environment (Liao et al. 2013).

Given the fact that the government’s control of information on the Chinese Web involves not only the marginalization (as opposed to the traditional censorship) of “unwanted” messages and information, but also the prioritisation of propaganda or pro-government messages (including those made by paid commentators and “robots”), I would add that the new challenges for researchers include the detection of paid (and sometimes robot-generated) comments. Although these challenges are not exactly the same as data access, researchers need to consider them for data collection.

Ed: How much of the content and traffic is identifiable or geolocatable by region (eg mainland vs Hong Kong, Taiwan, abroad)?

Han-Teng: Identifying geographic information from Chinese Web data, like other Web data, can be largely done by geo-IP (a straightforward IP to geographic location mapping service), domain names (.cn for China; .hk for Hong Kong; .tw for Taiwan), and language preferences (simplified Chinese used by mainland Chinese users; traditional Chinese used by Hong Kong and Taiwan). Again, like the question of data access, the availability and quality of such geographic and linguistic information depends on the policies, openness, and the availability of data intermediary and tools.

Nonetheless, there exist research efforts on using geographic and/or linguistic information of Chinese Web data to assess the level and extent of convergence and separation of Chinese information and users around the world (Etling et al. 2009; Liao 2008; Taneja and Wu 2013). Etling and colleagues (2009) concluded their mapping of Chinese blogsphere research with the interpretation of five “attentive spaces” roughly corresponding to five clusters or zones in the network map: on one side, two clusters of “Pro-state” and “Business” bloggers, and on the other, two clusters of “Overseas” bloggers (including Hong Kong and Taiwan) and “Culture”. Situated between the three clusters of “Pro-state”, “Overseas” and “Culture” (and thus at the centre of the network map) is the remaining cluster they call the “critical discourse” cluster, which is at the intersection of the two sides (albeit more on the “blocked” side of the Great Firewall).

I myself found distinct geographic focus and linguistic preferences between the online citations in Baidu Baike and Chinese Wikipedia (Liao 2008). Other research based on a sample of traffic data shows the existence of a “Chinese” cluster as an instance of a “culturally defined market”, regardless of their geographic and linguistic differences (Taneja and Wu 2013). Although I found their argument that the Great Firewall has very limited impacts on such a single “Chinese” cluster, they demonstrate the possibility of extracting geographic and linguistic information on Chinese Web data for better understanding the dynamics of Chinese online interactions; which are by no means limited within China or behind the Great Firewall.

Ed: In terms of online monitoring of public opinion, is it possible to identify robots / “50 cent party” — that is, what proportion of the “opinion” actually has a government source?

Han-Teng: There exist research efforts in identifying robot comments by analysing the patterns and content of comments, and their profile relationship with other accounts. It is more difficult to prove the direct footprint of government sources. Nonetheless, if researchers take another approach such as narrative analysis for well-defined propaganda research (such as the pro- and anti-Falun opinions), it might be easier to categorise and visualise the dynamics and then trace back to the origins of dominant keywords and narratives to identify the sources of loud messages. I personally think such research and analytical efforts require deep knowledge on both technical and cultural-political understanding of Chinese Web data, preferably with an integrated mixed method research design that incorporates both the quantitative and qualitative methods required for the data question at hand.

Ed: In terms of censorship, ISPs operate within explicit governmental guidelines; do the public (who contribute content) also have explicit rules about what topics and content are ‘acceptable’, or do they have to work it out by seeing what gets deleted?

Han-Teng: As a general rule, online censorship works better when individual contributors are isolated. Most of the time, contributors experience technical difficulties when using Beijing’s unwanted keywords or undesired websites, triggering self-censorship behaviours to avoid such difficulties. I personally believe such tacit learning serves as the most relevant psychological and behaviour mechanism (rather than explicit rules). In a sense, the power of censorship and political discipline is the fact that the real rules of engagement are never explicit to users, thereby giving more power to technocrats to exercise power in a more arbitrary fashion. I would describe the general situation as follows. Directives are given to both ISPs and ICPs about certain “hot terms”, some dynamic and some constant. Users “learn” them through encountering various forms of “technical difficulties”. Thus, while ISPs and ICPs may not enforce the same directives in the same fashion (some overshoot while others undershoot), the general tacit knowledge about the “red line” is thus delivered.

Nevertheless, there are some efforts where users do share their experiences with one another, so that they have a social understanding of what information and which category of users is being disciplined. There are also constant efforts outside mainland China, especially institutions in Hong Kong and Berkeley to monitor what is being deleted. However, given the fact that data is abundant for Chinese users, I have become more worried about the phenomenon of “marginalization of information and/or narratives”. It should be noted that censorship or deletion is just one of the tools of propaganda technocrats and that the Chinese Communist Party has had its share of historical lessons (and also victories) against its past opponents, such as the Chinese Nationalist Party and the United States during the Chinese Civil War and the Cold War. I strongly believe that as researchers we need better concepts and tools to assess the dynamics of information marginalization and prioritisation, treating censorship and data deletion as one mechanism of information marginalization in the age of data abundance and limited attention.

Ed: Has anyone tried to produce a map of censorship: ie mapping absence of discussion? For a researcher wanting to do this, how would they get hold of the deleted content?

Han-Teng: Mapping censorship has been done through experiment (MacKinnon 2008; Zhu et al. 2011) and by contrasting datasets (Fu et al. 2013; Liao 2013; Zhu et al. 2012). Here the availability of data intermediaries such as the WeiboScope in Hong Kong University, and unblocked alternative such as Chinese Wikipedia, serve as direct and indirect points of comparison to see what is being or most likely to be deleted. As I am more interested in mapping information marginalization (as opposed to prioritisation), I would say that we need more analytical and visualisation tools to map out the different levels and extent of information censorship and marginalization. The research challenges then shift to the questions of how and why certain content has been deleted inside mainland China, and thus kept or leaked outside China. As we begin to realise that the censorship regime can still achieve its desired political effects by voicing down the undesired messages and voicing up the desired ones, researchers do not necessarily have to get hold of the deleted content from the websites inside mainland China. They can simply reuse plenty of Chinese Web data available outside the censorship and filtering regime to undertake experiments or comparative study.

Ed: What other questions are people trying to explore or answer with data from the “Chinese Web”? And what are the difficulties? For instance, are there enough tools available for academics wanting to process Chinese text?

Han-Teng: As Chinese societies (including mainland China, Hong Kong, Taiwan and other overseas diaspora communities) go digital and networked, it’s only a matter of time before Chinese Web data becomes the equivalent of English Web data. However, there are challenges in processing Chinese language texts, although several of the major challenges become manageable as digital and network tools go multilingual. In fact, Chinese-language users and technologies have been the major goal and actors for a multi-lingual Internet (Liao 2009a,b). While there is technical progress in basic tools, we as Chinese Internet researchers still lack data and tool intermediaries that are designed to process Chinese texts smoothly. For instance, many analytical software and tools depend on or require the use of space characters as word boundaries, a condition that does not apply to Chinese texts.

In addition, since there exist some technical and interpretative challenges in analysing Chinese text datasets with mixed scripts (e.g. simplified and traditional Chinese) or with other foreign languages. Mandarin Chinese language is not the only language inside China; there are indications that the Cantonese and Shanghainese languages have a significant presence. Minority languages such as Tibetan, Mongolian, Uyghur, etc. are also still used by official Chinese websites to demonstrate the cultural inclusiveness of the Chinese authorities. Chinese official and semi-official diplomatic organs have also tried to tell “Chinese stories” in various of the world’s major languages, sometimes in direct competition with its political opponents such as Falun Gong.

These areas of the “Chinese Web” data remain unexplored territory for systematic research, which will require more tools and methods that are similar to the toolkits of multi-lingual Internet researchers. Hence I would say the basic data and tool challenges are not particular to the “Chinese Web”, but are rather a general challenge to the “Web” that is becoming increasingly multilingual by the day. We Chinese Internet researchers do need more collaboration when it comes to sharing data and tools, and I am hopeful that we will have more trustworthy and independent data intermediaries, such as Weiboscope and others, for a better future of the Chinese Web data ecology.

References

Bamman, D., O’Connor, B., & Smith, N. (2012). Censorship and deletion practices in Chinese social media. First Monday, 17(3-5).

Etling, B., Kelly, J., & Faris, R. (2009). Mapping Chinese Blogosphere. In 7th Annual Chinese Internet Research Conference (CIRC 2009). Annenberg School for Communication, University of Pennsylvania, Philadelphia, US.

Fu, K., Chan, C., & Chau, M. (2013). Assessing Censorship on Microblogs in China: Discriminatory Keyword Analysis and Impact Evaluation of the “Real Name Registration” Policy. IEEE Internet Computing, 17(3), 42–50.

Fu, K., & Chau, M. (2013). Reality Check for the Chinese Microblog Space: a random sampling approach. PLOS ONE, 8(3), e58356.

Jiang, M., & Akhtar, A. (2011). Peer into the Black Box of Chinese Search Engines: A Comparative Study of Baidu, Google, and Goso. Presented at the The 9th Chinese Internet Research Conference (CIRC 2011), Washington, D.C.: Institute for the Study of Diplomacy. Georgetown University.

King, G., Pan, J., & Roberts, M. (2012). How censorship in China allows government criticism but silences collective expression. In APSA 2012 Annual Meeting Paper.

Liao, H.-T. (2008). A webometric comparison of Chinese Wikipedia and Baidu Baike and its implications for understanding the Chinese-speaking Internet. In 9th annual Internet Research Conference: Rethinking Community, Rethinking Place. Copenhagen.

Liao, H.-T. (2009a). Are Chinese characters not modern enough? An essay on their role online. GLIMPSE: the art + science of seeing, 2(1), 16–24.

Liao, H.-T. (2009b). Conflict and Consensus in the Chinese version of Wikipedia. IEEE Technology and Society Magazine, 28(2), 49–56. doi:10.1109/MTS.2009.932799

Liao, H.-T. (2013, August 5). How do Baidu Baike and Chinese Wikipedia filter contribution? A case study of network gatekeeping. To be presented at the Wikisym 2013: The Joint International Symposium on Open Collaboration, Hong Kong.

Liao, H.-T., Fu, K., Jiang, M., & Wang, N. (2013, June 15). Chinese Web Data: Definition, Uses, and Scholarship. (Accepted). To be presented at the 11th Annual Chinese Internet Research Conference (CIRC 2013), Oxford, UK.

MacKinnon, R. (2008). Flatter world and thicker walls? Blogs, censorship and civic discourse in China. Public Choice, 134(1), 31–46. doi:10.1007/s11127-007-9199-0

Taneja, H., & Wu, A. X. (2013). How Does the Great Firewall of China Affect Online User Behavior? Isolated “Internets” as Culturally Defined Markets on the WWW. Presented at the 11th Annual Chinese Internet Research Conference (CIRC 2013), Oxford, UK.

Zhu, T., Bronk, C., & Wallach, D. S. (2011). An Analysis of Chinese Search Engine Filtering. arXiv:1107.3794.

Zhu, T., Phipps, D., Pridgen, A., Crandall, J. R., & Wallach, D. S. (2012). Tracking and Quantifying Censorship on a Chinese Microblogging Site. arXiv:1211.6166.


Han-Teng was talking to blog editor David Sutcliffe.

Han-Teng Liao is an OII DPhil student whose research aims to reconsider the role of keywords (as in understanding “keyword advertising” using knowledge from sociolinguistics and information science) and hyperlinks (webometrics) in shaping the sense of “fellow users” in digital networked environments. Specifically, his DPhil project is a comparative study of two major user-contributed Chinese encyclopedias, Chinese Wikipedia and Baidu Baike.