crowd sourcing

While traditional surveillance systems will remain the pillars of public health, online media monitoring has added an important early-warning function, with social media bringing additional benefits to epidemic intelligence.

Communication of risk in any public health emergency is a complex task for healthcare agencies; a task made more challenging when citizens are bombarded with online information. Mexico City, 2009. Image by Eneas.

Ed: Could you briefly outline your study? Patty: We investigated the role of Twitter during the 2009 swine flu pandemics from two perspectives. Firstly, we demonstrated the role of the social network to detect an upcoming spike in an epidemic before the official surveillance systems—up to week in the UK and up to 2-3 weeks in the US—by investigating users who “self-diagnosed” themselves posting tweets such as “I have flu/swine flu.” Secondly, we illustrated how online resources reporting the WHO declaration of “pandemics” on 11 June 2009 were propagated through Twitter during the 24 hours after the official announcement [1,2,3]. Ed: Disease control agencies already routinely follow media sources; are public health agencies  aware of social media as another valuable source of information? Patty:  Social media are providing an invaluable real-time data signal complementing well-established epidemic intelligence (EI) systems monitoring online media, such as MedISys and GPHIN. While traditional surveillance systems will remain the pillars of public health, online media monitoring has added an important early-warning function, with social media bringing additional benefits to epidemic intelligence: virtually real-time information available in the public domain that is contributed by users themselves, thus not relying on the editorial policies of media agencies. Public health agencies (such as the European Centre for Disease Prevention and Control) are interested in social media early warning systems, but more research is required to develop robust social media monitoring solutions that are ready to be integrated with agencies’ EI services. Ed: How difficult is this data to process? E.g.: is this a full sample, processed in real-time? Patty:  No, obtaining all Twitter search query results is not possible. In our 2009 pilot study we were accessing data from Twitter using a search API interface querying the database every minute (the number of results was limited to 100 tweets). Currently, only 1% of the ‘Firehose’ (massive real-time stream of all public tweets) is made available using the streaming API. The searches have…

The Middle East and North Africa are relatively under-represented in Wikipedia. Even after accounting for factors like population, Internet access, and literacy, we still see less contact than would be expected.

Editors from all over the world have played some part in writing about Egypt; in fact, only 13% of all edits actually originate in the country (38% are from the US). More: Who edits Wikipedia? by Mark Graham. Ed: In basic terms, what patterns of ‘information geography’ are you seeing in the region? Mark: The first pattern that we see is that the Middle East and North Africa are relatively under-represented in Wikipedia. Even after accounting for factors like population, Internet access, and literacy, we still see less contact than would be expected. Second, of the content that exists, a lot of it is in European and French rather than in Arabic (or Farsi or Hebrew). In other words, there is even less in local languages. And finally, if we look at contributions (or edits), not only do we also see a relatively small number of edits originating in the region, but many of those edits are being used to write about other parts of the word rather than their own region. What this broadly seems to suggest is that the participatory potentials of Wikipedia aren’t yet being harnessed in order to even out the differences between the world’s informational cores and peripheries. Ed: How closely do these online patterns in representation correlate with regional (offline) patterns in income, education, language, access to technology (etc.) Can you map one to the other? Mark: Population and broadband availability alone explain a lot of the variance that we see. Other factors like income and education also play a role, but it is population and broadband that have the greatest explanatory power here. Interestingly, it is most countries in the MENA region that fail to fit well to those predictors. Ed: How much do you think these patterns result from the systematic imposition of a particular view point—such as official editorial policies—as opposed to the (emergent) outcome of lots of users and editors…

The more that differing points of view and differing evaluative frames came into contact, the more the community worked together to generate rules and norms to regulate and improve the production of articles.

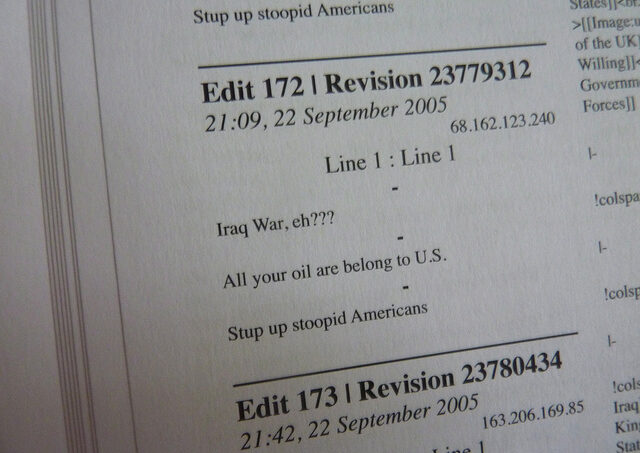
Image from "The Iraq War: A Historiography of Wikipedia Changelogs," a twelve-volume set of all changes to the Wikipedia article on the Iraq War (totalling over 12,000 changes and almost 7,000 pages), by STML.

Ed: I really like the way that, contrary to many current studies on conflict and Wikipedia, you focus on how conflict can actually be quite productive. How did this insight emerge? Kim: I was initially looking for instances of collaboration in Wikipedia to see how popular debates about peer production played out in reality. What I found was that conflict was significantly more prevalent than I had assumed. It struck me as interesting, as most of the popular debates at the time framed conflict as hindering the collaborative editorial process. After several stages of coding, I found that the conversations that involved even a minor degree of conflict were fascinating. A pattern emerged where disagreements about the editorial process resulted in community members taking positive actions to solve the discord and achieve consensus. This was especially prominent in early discussions prior to 2005 before many of the policies that regulate content production in the encyclopaedia were formulated. The more that differing points of view and differing evaluative frames came into contact, the more the community worked together to generate rules and norms to regulate and improve the production of articles. Ed: You use David Stark’s concept of generative friction to describe how conflict is ‘central to the editorial processes of Wikipedia’. Can you explain why this is important? Kim: Having different points of view come into contact is the premise of Wikipedia’s collaborative editing model. When these views meet, Stark maintains there is an overlap of individuals’ evaluative frames, or worldviews, and it is in this overlap that creative solutions to problems can occur. People come across solutions they may not otherwise have encountered in the typical homogeneous, hierarchical system that is traditionally the standard for institutions trying to maximise efficiency. In this respect, conflict is central to the process as it is about the struggle to negotiate meaning and achieve a consensus among editors with differing opinions and perspectives.…

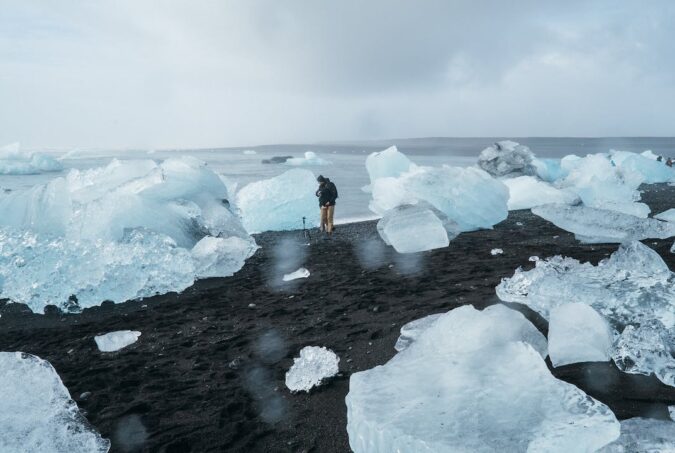
The platform aims to create long-lasting scientific value with minimal technical entry barriers—it is valuable to have a global resource that combines photographs generated by Project Pressure in less documented areas.

Ed: Project Pressure has created a platform for crowdsourcing glacier imagery, often photographs taken by climbers and trekkers. Why are scientists interested in these images? And what’s the scientific value of the data set that’s being gathered by the platform? Klaus: Comparative photography using historical photography allows year-on-year comparisons to document glacier change. The platform aims to create long-lasting scientific value with minimal technical entry barriers—it is valuable to have a global resource that combines photographs generated by Project Pressure in less documented areas, with crowdsourced images taken by for example by climbers and trekkers, combined with archival pictures. The platform is future focused and will hopefully allow an up-to-date view on glaciers across the planet. The other ways for scientists to monitor glaciers takes a lot of time and effort; direct measurements of snow fall is a complicated, resource intensive and time-consuming process. And while glacier outlines can be traced from satellite imagery, this still needs to be done manually. Also, you can’t measure the thickness, images can be obscured by debris and cloud cover, and some areas just don’t have very many satellite fly-bys. Ed: There are estimates that the glaciers of Montana’s Glacier National Park will likely to be gone by 2020 and the Ugandan glaciers by 2025, and the Alps are rapidly turning into a region of lakes. These are the famous and very visible examples of glacier loss—what’s the scale of the missing data globally? Klaus: There’s a lot of great research being conducted in this area, however there are approximately 300,000 glaciers world wide, with huge data gaps in South America and the Himalayas for instance. Sharing of Himalayan data between Indian and Chinese scientists has been a sensitive issue, given glacier meltwater is an important strategic resource in the region. But this is a popular trekking route, and it is relatively easy to gather open-source data from the public. Furthermore, there are also…

If you have ever worried about media bias then you should really worry about the impact of translation.

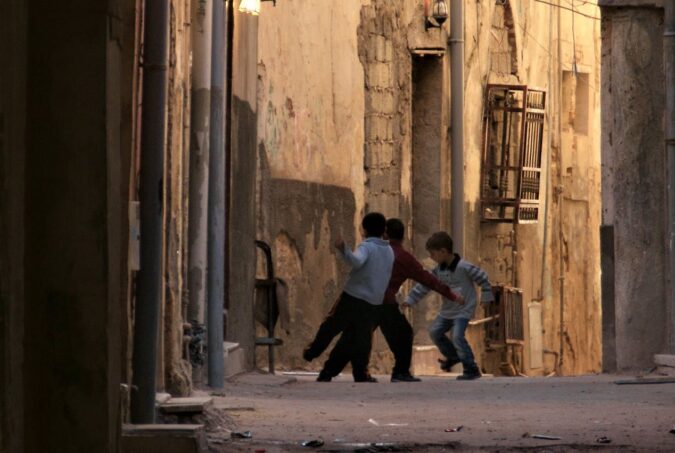
As revolution spread across North Africa and the Middle East in 2011, participants and observers of the events were keen to engage via social media. However, saturation by Arab-language content demanded a new translation strategy for those outside the region to follow the information flows—and for those inside to reach beyond their domestic audience. Crowdsourcing was seen as the most efficient strategy in terms of cost and time to meet the demand, and translation applications that harnessed volunteers across the internet were integrated with nearly every type of ICT project. For example, as Steve Stottlemyre has already mentioned on this blog, translation played a part in tools like the Libya Crisis Map, and was essential for harnessing tweets from the region’s ‘voices on the ground.’ If you have ever worried about media bias then you should really worry about the impact of translation. Before the revolutions, the translation software for Egyptian Arabic was almost non-existent. Few translation applications were able to handle the different Arabic dialects or supply coding labor and capital to build something that could contend with internet blackouts. Google’s Speak to Tweet became the dominant application used in the Egyptian uprisings, delivering one homogenised source of information that fed the other sources. In 2011, this collaboration helped circumvent the problem of Internet connectivity in Egypt by allowing cellphone users to call their tweet into a voicemail to be transcribed and translated. A crowd of volunteers working for Twitter enhanced translation of Egyptian Arabic after the Tweets were first transcribed by a Mechanical Turk application trained from an initial 10 hours of speech. The unintended consequence of these crowdsourcing applications was that when the material crossed the language barrier into English, it often became inaccessible to the original contributors. Individuals on the ground essentially ceded authorship to crowds of untrained volunteer translators who stripped the information of context, and then plotted it in categories and on maps without feedback from…

While many people continued to contribute conventional humanitarian information to the map, the sudden shift toward information that could aid international military intervention was unmistakable.

The Middle East has recently witnessed a series of popular uprisings against autocratic rulers. In mid-January 2011, Tunisian President Zine El Abidine Ben Ali fled his country, and just four weeks later, protesters overthrew the regime of Egyptian President Hosni Mubarak. Yemen’s government was also overthrown in 2011, and Morocco, Jordan, and Oman saw significant governmental reforms leading, if only modestly, toward the implementation of additional civil liberties. Protesters in Libya called for their own ‘day of rage’ on February 17, 2011, marked by violent protests in several major cities, including the capitol Tripoli. As they transformed from ‘protestors’ to ‘Opposition forces’ they began pushing information onto Twitter, Facebook, and YouTube, reporting their firsthand experiences of what had turned into a civil war virtually overnight. The evolving humanitarian crisis prompted the United Nations to request the creation of the Libya Crisis Map, which was made public on March 6, 2011. Other, more focused crisis maps followed, and were widely distributed on Twitter. While the map was initially populated with humanitarian information pulled from the media and online social networks, as the imposition of an internationally enforced No Fly Zone (NFZ) over Libya became imminent, information began to appear on it that appeared to be of a tactical military nature. While many people continued to contribute conventional humanitarian information to the map, the sudden shift toward information that could aid international military intervention was unmistakable. How useful was this information, though? Agencies in the U.S. Intelligence Community convert raw data into useable information (incorporated into finished intelligence) by utilising some form of the Intelligence Process. As outlined in the U.S. military’s joint intelligence manual, this consists of six interrelated steps all centred on a specific mission. It is interesting that many Twitter users, though perhaps unaware of the intelligence process, replicated each step during the Libyan civil war; producing finished intelligence adequate for consumption by NATO commanders and rebel leadership. It…

The Internet can be hugely useful to coordinate disaster relief efforts, or to help rebuild affected communities.

Wikimedia Commons

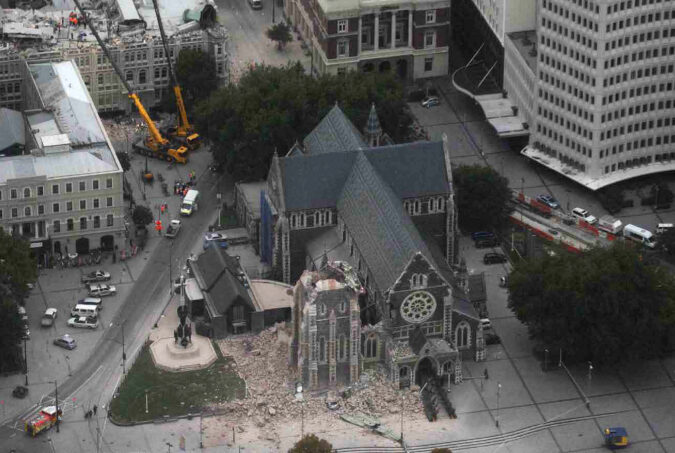
The 6.2 magnitude earthquake that struck the centre of Christchurch on 22 February 2011 claimed 185 lives, damaged 80% of the central city beyond repair, and forced the abandonment of 6000 homes. It was the third costliest insurance event in history. The CEISMIC archive developed at the University of Canterbury will soon have collected almost 100,000 digital objects documenting the experiences of the people and communities affected by the earthquake, all of it available for study. The Internet can be hugely useful to coordinate disaster relief efforts, or to help rebuild affected communities. Paul Millar came to the OII on 21 May 2012 to discuss the CEISMIC archive project and the role of digital humanities after a major disaster (below). We talked to him afterwards. Ed: You have collected a huge amount of information about the earthquake and people’s experiences that would otherwise have been lost: how do you think it will be used? Paul: From the beginning I was determined to avoid being prescriptive about eventual uses. The secret of our success has been to stick to the principles of open data, open access and collaboration—the more content we can collect, the better chance future generations have to understand and draw conclusions from our experiences, behaviour and decisions. We have already assisted a number of research projects in public health, the social and physical sciences; even accounting. One of my colleagues reads balance sheets the way I read novels, and discovers all sorts of earthquake-related signs of cause and effect in them. I’d never have envisaged such a use for the archive. We have made our ontology is as detailed and flexible as possible in order to help with re-purposing of primary material: we currently use three layers of metadata—machine generated, human-curated and crowd sourced. We also intend to work more seriously on our GIS capabilities. Ed: How do you go about preserving this information during a period of…