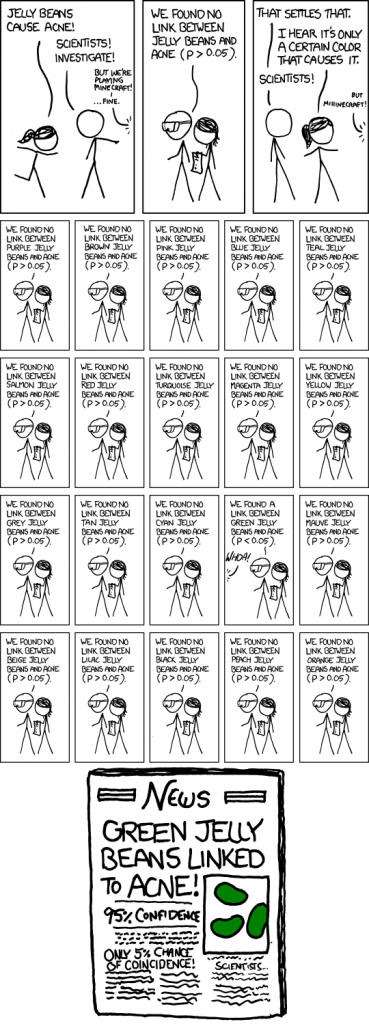
P-values are widely used in the social sciences, especially ‘big data’ studies, to calculate statistical significance. Yet they are widely criticised for being easily hacked, and for not telling us what we want to know. Many have argued that, as a result, research is wrong far more often than we realize. In their recent article P-values: Misunderstood and Misused OII Research Fellow Taha Yasseri and doctoral student Bertie Vidgen argue that we need to make standards for interpreting p-values more stringent, and also improve transparency in the academic reporting process, if we are to maximise the value of statistical analysis.

statistical significance from XKCD. Available online at
http://xkcd.com/882/
In an unprecedented move, the American Statistical Association recently released a statement (March 7 2016) warning against how p-values are currently used. This reflects a growing concern in academic circles that whilst a lot of attention is paid to the huge impact of big data and algorithmic decision-making, there is considerably less focus on the crucial role played by statistics in enabling effective analysis of big data sets, and making sense of the complex relationships contained within them. Because much as datafication has created huge social opportunities, it has also brought to the fore many problems and limitations with current statistical practices. In particular, the deluge of data has made it crucial that we can work out whether studies are ‘significant’. In our paper, published three days before the ASA’s statement, we argued that the most commonly used tool in the social sciences for calculating significance—the p-value—is misused, misunderstood and, most importantly, doesn’t tell us what we want to know.
The basic problem of ‘significance’ is simple: it is simply unpractical to repeat an experiment an infinite number of times to make sure that what we observe is “universal”. The same applies to our sample size: we are often unable to analyse a “whole population” sample and so have to generalise from our observations on a limited size sample to the whole population. The obvious problem here is that what we observe is based on a limited number of experiments (sometimes only one experiment) and from a limited size sample, and as such could have been generated by chance rather than by an underlying universal mechanism! We might find it impossible to make the same observation if we were to replicate the same experiment multiple times or analyse a larger sample. If this is the case then we will mischaracterise what is happening—which is a really big problem given the growing importance of ‘evidence-based’ public policy. If our evidence is faulty or unreliable then we will create policies, or intervene in social settings, in an equally faulty way.
The way that social scientists have got round this problem (that samples might not be representative of the population) is through the ‘p-value’. The p-value tells you the probability of making a similar observation in a sample with the same size and in the same number of experiments, by pure chance In other words, it is actually telling you is how likely it is that you would see the same relationship between X and Y even if no relationship exists between them. On the face of it this is pretty useful, and in the social sciences we normally say that a p-value of 1 in 20 means the results are significant. Yet as the American Statistical Association has just noted, even though they are incredibly widespread many researchers mis-interpret what p-values really mean.
In our paper we argued that p-values are misunderstood and misused because people think the p-value tells you much more than it really does. In particular, people think the p-value tells you (i) how likely it is that a relationship between X and Y really exists and (ii) the percentage of all findings that are false (which is actually something different called the False Discovery Rate). As a result, we are far too confident that academic studies are correct. Some commentators have argued that at least 30% of studies are wrong because of problems related to p-values: a huge figure. One of the main problems is that p-values can be ‘hacked’ and as such easily manipulated to show significance when none exists.
If we are going to base public policy (and as such public funding) on ‘evidence’ then we need to make sure that the evidence used is reliable. P-values need to be used far more rigorously, with significance levels of 0.01 or 0.001 seen as standard. We also need to start being more open and transparent about how results are recorded. It is a fine line between data exploration (a legitimate academic exercise) and ‘data dredging’ (where results are manipulated in order to find something noteworthy). Only if researchers are honest about what they are doing will we be able to maximise the potential benefits offered by Big Data. Luckily there are some great initiatives—like the Open Science Framework—which improve transparency around the research process, and we fully endorse researchers making use of these platforms.
Scientific knowledge advances through corroboration and incremental progress, and it is crucial that we use and interpret statistics appropriately to ensure this progress continues. As our knowledge and use of big data methods increase, we need to ensure that our statistical tools keep pace.
Read the full paper: Vidgen, B. and Yasseri, T., (2016) P-values: Misunderstood and Misused, Frontiers in Physics, 4:6. http://dx.doi.org/10.3389/fphy.2016.00006
Bertie Vidgen is a doctoral student at the Oxford Internet Institute researching far-right extremism in online contexts. He is supervised by Dr Taha Yasseri, a research fellow at the Oxford Internet Institute interested in how Big Data can be used to understand human dynamics, government-society interactions, mass collaboration, and opinion dynamics.

