Category: Mapping
All topics
-

Crowdsourcing translation during crisis situations: are ‘real voices’ being excluded from the decisions and policies it supports?
If you have ever worried about media bias then you should really worry about the…
-
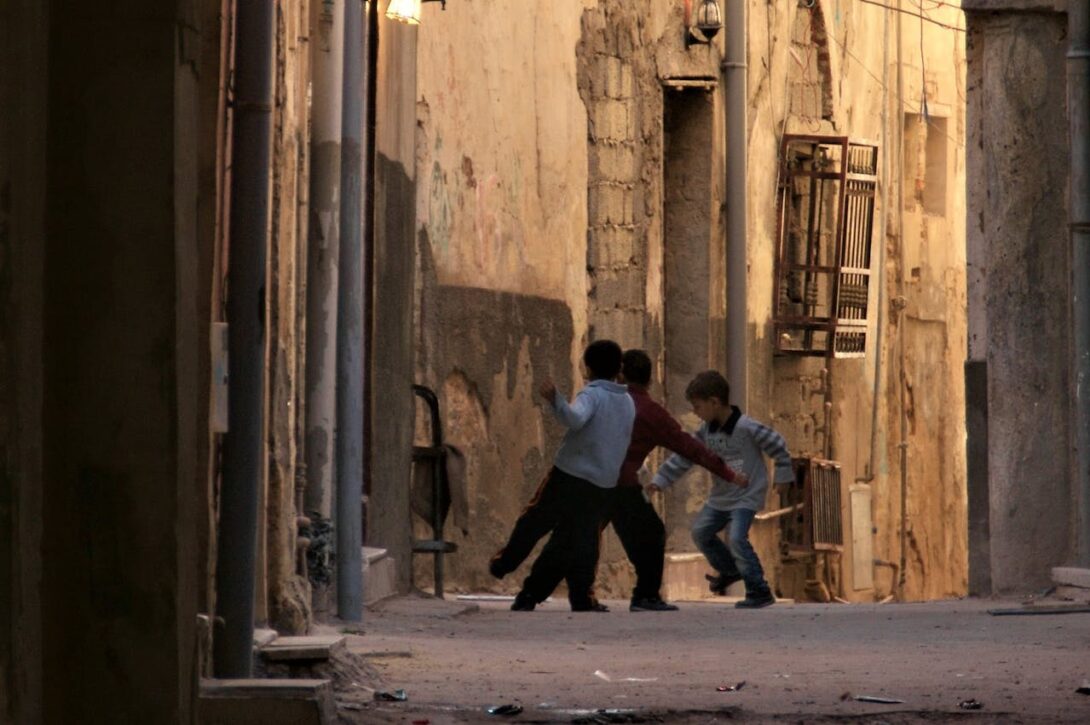
Did Libyan crisis mapping create usable military intelligence?
While many people continued to contribute conventional humanitarian information to the map, the sudden shift…